| โบรกเกอร์ | เสนอ | ฝากขั้นต่ำ | ซื้อขายทันที |
|---|---|---|---|
|
|
สินทรัพย์: 300+
นาที. ซื้อขาย: $1 อัตราผลตอบแทน: 100% การจ่ายเงิน 3 วัน |
$10
|
ซื้อขายตอนนี้ |
|
|
สินทรัพย์: 300+
นาที. ซื้อขาย: $1 อัตราผลตอบแทน: 100% การจ่ายเงิน 3 วัน |
$10
|
ซื้อขายตอนนี้ |
|
|
สินทรัพย์: 300+
นาที. ซื้อขาย: $1 อัตราผลตอบแทน: 100% การจ่ายเงิน 3 วัน |
$10
|
ซื้อขายตอนนี้ |
|
|
สินทรัพย์: 300+
นาที. ซื้อขาย: $1 อัตราผลตอบแทน: 100% การจ่ายเงิน 3 วัน |
$10
|
ซื้อขายตอนนี้ |
Analyzing price directly from candlestick charts is at the heart of what many professional traders do. Not because it’s easy, but because it’s the most direct and closest approach to the market. The Th-Option team has compiled everything you need to know about price action, from the fundamentals to strategies you can actually use in forex trading — all in this article.
What Is Price Action Trading and Why Do Traders Value It So Highly
Price action is the method of analyzing the market by reading price behavior directly — without indicators, without formulas. Traders who use this approach look at pure candlestick charts and interpret what price is telling them.
Price Action — A Practical Definition
Price action refers to the behavior of price that traders use to analyze candlestick patterns. Since prices in the market are the direct result of buying and selling pressure, price action is used to observe the current market situation — reading changes from the characteristics of candlestick groups. For example, when buying pressure weakens and selling pressure takes over, or when price repeatedly approaches resistance and reverses. These are signals that price action provides before any indicator can.
To put it more directly: price action is reading who is currently winning — buyers or sellers — and from the patterns that form, predicting who will win over the next few candles.
Unlike indicators that calculate from historical prices and often give delayed signals, price action provides real-time information because it is the price itself, not a value derived from price.
Why Is Price Action Trading So Popular in Forex
The forex market has extremely high liquidity, so price patterns are clearer than in smaller markets. Institutional traders, hedge funds, and market makers all leave footprints on the chart, and price action helps you read those footprints.
Tangible advantages:
- No lag — every indicator calculates from the past, but current price is real data
- Works on every timeframe — from M5 to Monthly, the same signals apply
- Adapts to all market conditions — uptrend, downtrend, and sideways can all be read using the same principles
- No expensive tools needed — a bare chart on TradingView’s free plan is sufficient
But let’s be straightforward: price action is not a shortcut. It requires real screen time and market context understanding that builds from experience.
Core Concepts of Price Action: Support, Resistance, and Market Structure
Before you can read candlestick patterns, you must first understand market structure — because the same pattern occurring at different locations carries completely different meanings.
Support and Resistance — The Essential Foundation
Before drawing any trend line or support/resistance line on a chart, you need to understand what those lines represent in terms of buying and selling pressure.
Support is a price level where buying pressure has repeatedly stepped in, causing price to stop falling or reverse. The more frequently price has bounced from that level, the more significant that support becomes.
Resistance is the opposite — a level where selling pressure repeatedly enters, preventing price from breaking through.
A common mistake: support and resistance are not thin lines but “zones,” because the market doesn’t stop at the exact same point every time. Plotting support and resistance as zones produces more realistic results.
Uptrend, Downtrend, and Sideways Structure
Reading market structure is the most fundamental skill:
- Uptrend: Price makes consecutive higher highs (HH) and higher lows (HL) — buyers dominate the market
- Downtrend: Price makes consecutive lower highs (LH) and lower lows (LL) — sellers dominate the market
- Sideways: Price oscillates within a narrow range between support and resistance with no clear direction
A warning signal professional traders watch for: when an uptrend starts making lower highs and lower lows, that’s the first sign the structure is changing — not just a regular pullback.
Price Reflects All Information — But Can Be Interpreted in Multiple Ways
The principle that price action adheres to is that market price reflects everything everyone already knows — news, expectations, and the actions of large institutions. The chart is therefore the “result” of everything.
But be cautious: price reflects information — that doesn’t mean price predicts the future with 100% accuracy. It indicates “probability,” not certainty.
Price Action Strategies for Pro Traders — False Breakout, Liquidity Grab, and Stop Hunt
This is the section that separates beginners from traders with real experience.
False Breakout — When a Good-Looking Breakout Turns Into a Trap
A false breakout occurs when price breaks through a key support or resistance level and then quickly reverses back inside. It is one of the patterns that cause beginners to lose money most frequently.
Why false breakouts happen: Large market participants know where stop loss orders are clustered. They may push price through those levels to trigger retail traders’ stops before reversing.
How to handle it: This doesn’t mean avoiding all breakouts, but you should wait for confirmation first — such as waiting for a candle to close beyond the level, not just a wick touching it, or waiting for a retest before entering.
Liquidity Grab — When Price Sweeps Stops Before Reversing
A liquidity grab is when price moves sharply beyond a point where stop losses are clustered to “collect liquidity” before reversing to its true direction.
How to spot it: Price quickly breaks through a previous low or high, then closes back within the same candle. It often appears as a pin bar with an unusually long wick.
Benefit for traders: When you see a liquidity grab at a key level, it’s often an entry point with excellent risk/reward — because you can place a tight stop loss (behind the wick) while the target is far away.
Stop Hunt — The Game the Market Plays on Retail Traders
A stop hunt is similar to a liquidity grab but emphasizes the intentional “hunting” of retail traders’ stops. It often occurs during thin market conditions, such as before the New York session opens or during major news events.
How to protect yourself: Place your stop at a structurally logical position — not right behind support/resistance, because that’s where everyone places theirs. Add a small buffer beyond it.
Price Action Candlestick Patterns Most Commonly Used in Forex Trading
All 12 Price Action Patterns — The Candlestick Table You Need to Know
| No. | Pattern | Type | Signal | Best Location |
| 1 | Pin Bar | Reversal | Long wick — price rejection | At key support/resistance |
| 2 | Bullish Engulfing | Bullish reversal | Green candle engulfs red candle | End of downtrend / support |
| 3 | Bearish Engulfing | Bearish reversal | Red candle engulfs green candle | End of uptrend / resistance |
| 4 | Inside Bar | Continuation/Reversal | Candle within prior candle’s range | After breakout / key levels |
| 5 | Outside Bar | Reversal | Candle engulfs both sides | Support/resistance during volatility |
| 6 | Doji | Indecision | Open and close nearly equal | End of trend or before news |
| 7 | Morning Star | Bullish reversal | 3-candle pattern — Doji in middle | Strong support |
| 8 | Evening Star | Bearish reversal | 3-candle pattern — Doji in middle | Strong resistance |
| 9 | Three White Soldiers | Bullish continuation | 3 consecutive green candles | Start of uptrend |
| 10 | Three Black Crows | Bearish continuation | 3 consecutive red candles | Start of downtrend |
| 11 | Hammer | Bullish reversal | Long lower wick, body at top | Support or end of downtrend |
| 12 | Shooting Star | Bearish reversal | Long upper wick, body at bottom | Resistance or end of uptrend |
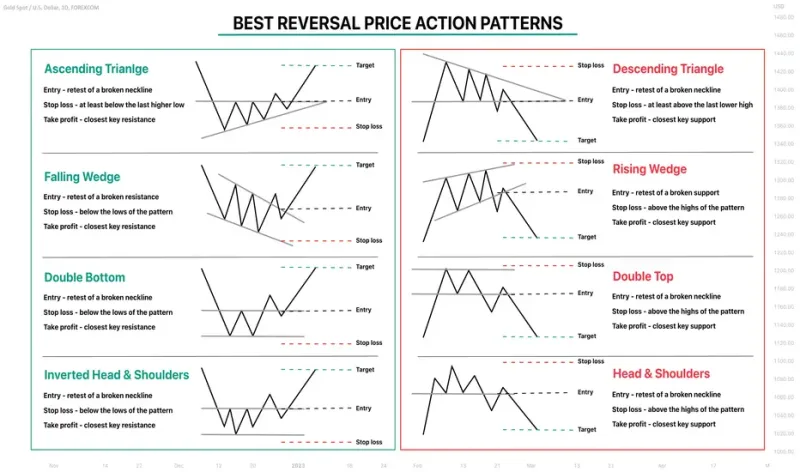
Reversal and Continuation Patterns — Doji, Star, and Others
Reversal patterns such as Pin Bar, Engulfing, and Morning/Evening Star typically form at the end of trends and at key levels. They are most reliable when:
- They occur at a highly significant level
- A higher timeframe supports the signal
- Volume is unusual (if data is available)
Continuation patterns such as Inside Bar, Flag, and Three Soldiers/Crows typically form mid-trend. They are used to add to a position or enter a trade whose starting point was missed.
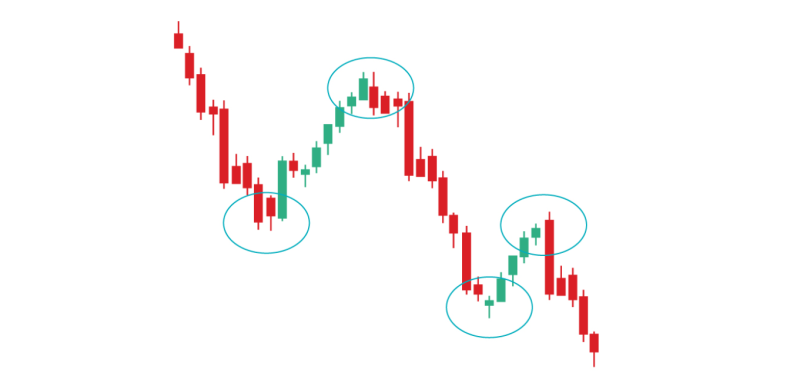
In terms of general price patterns, an up bar is a candle that closes higher than the previous one, indicating dominant buying pressure. A down bar is a candle that closes lower than the previous one, indicating sellers are in control during that period. Counting consecutive up bars and down bars helps provide preliminary trend direction confirmation.
Pin Bar, Hammer, and Shooting Star — The Patterns Traders Use Most
A pin bar is a candlestick with a long wick on one side and a short body. The principle is: price moved in one direction and was then rejected back sharply, indicating that the “losing” side has run out of momentum.
Bullish pin bar: Long lower wick — price tried to go down but was pushed back up — a buy signal at support.
Bearish pin bar: Long upper wick — price tried to go up but was pushed down — a sell signal at resistance.
Bullish and Bearish Engulfing — Reading the Buy-Sell Balance
A bullish engulfing occurs when a new green candle completely engulfs the previous red candle — the green body must be larger than the red body. This indicates buying pressure has returned stronger than before.
A bearish engulfing is the opposite — a red candle engulfs the green candle — selling pressure takes control of the market.
Inside Bar and Outside Bar
Inside bar: A candle whose high and low fall within the range of the previous candle (mother bar). It indicates a pause or accumulation of energy before a breakout in one direction.
Outside bar: A candle that engulfs both the high and low of the previous candle. It indicates high volatility and uncertainty. It is often used as a reversal signal when it forms at a key level.
Price Action Trading Strategies — Structured System Thinking
Knowing individual patterns is the starting point, but it’s not enough. What real traders need is a system that applies patterns within context.
Example: Simple PA Strategy — Trend + Level + Pattern + Confirmation
Step 1 — Identify the Trend from a Higher Timeframe. Using price action starts by opening a bare chart with no indicators, then looking at the overall picture on Daily or H4 to determine whether the market is in an uptrend, downtrend, or sideways. Trading in the direction of the larger trend significantly increases your odds of success.
Step 2 — Find Key Levels. Identify significant support and resistance zones on the higher timeframe. These zones are the “battlegrounds” where candlestick patterns carry the most weight.
Step 3 — Wait for a Pattern. When price reaches a key level, watch a smaller timeframe (H1 or M15) for reversal or continuation patterns — such as a pin bar, engulfing, or inside bar breakout.
Step 4 — Confirmation. Always wait for the candle to close before entering. Never enter while the candle is still forming. This is the difference between “guessing” and “reading.”
Step 5 — Entry, Stop Loss, Take Profit
- Entry: After the confirmation candle closes
- Stop Loss: Behind a logical structure (not right at support/resistance)
- Take Profit: The next resistance/support level or at least a 1:2 R:R ratio
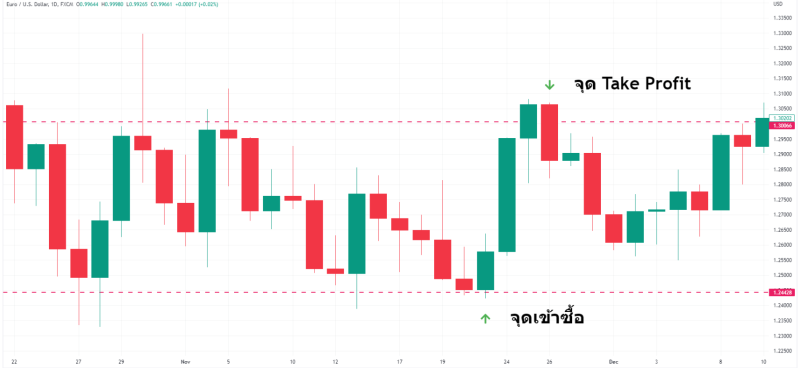
Real Example (EUR/USD Uptrend): The Daily chart shows a clear uptrend — price pulls back to a previous support level (S line). On H1, a bullish pin bar forms at that level. The candle has closed. Enter buy above the pin bar’s high. Place stop below the pin bar’s wick. Set target at the previous high.
Example 2 (GBP/JPY Downtrend): The H4 chart shows a downtrend. Price bounces up to retest a previous resistance level. On H1, a bearish engulfing forms at that level. Enter sell below the engulfing candle’s low. Place stop above the candle’s high. Take profit at the previous low.
Price Action Patterns — Analysis by Timeframe
Which Timeframe and Trend Line Are Best for Price Action Trading
There is no universal answer, but here are practical guidelines:
| Trading Style | Analysis Timeframe | Entry Timeframe | Holding Period |
| Scalping | H1 / M15 | M5 / M1 | Minutes to hours |
| Intraday | H4 / H1 | M15 / M5 | Hours to 1 day |
| Swing | Daily / H4 | H1 / H4 | Days to weeks |
| Position | Weekly / Daily | Daily / H4 | Weeks to months |
The Top-Down Analysis principle: Start from a higher timeframe to see context, then move down to find entry points on a smaller timeframe. For example, look at Daily for the trend and key levels, then go to H1 to find patterns.
Signals that align across multiple timeframes are always more reliable.
Who Is Price Action Suited For, and What Are Its Limitations
Price Action Is Suited For
- Traders who want to understand the market from its foundation, not just press buy/sell based on signals
- Those who have time to study charts and accumulate screen time
- Traders who want a flexible, adaptable approach
- Anyone trading forex, gold, crypto, or indices — price action works across all markets
Limitations of Price Action You Must Accept
This is the part many textbooks skip, but it’s critically important:
- Highly subjective — Two traders looking at the same chart may see completely different things. There are no fixed rules; you must develop your own judgment through experience
- Requires extensive screen time — You can’t copy signals and use them. You need to actually sit and watch charts to build the skill
- Many false signals — Every pattern mentioned can fail, especially in sideways markets where patterns tend to deceive
- Not suitable for beginners without structure — If you only learn pattern names without understanding context, you’ll lose money by seeing patterns at the wrong place and time
- Trending markets work better than sideways — During range-bound periods, price action signals tend to be more deceptive than usual. Extra caution is needed
In short: price action can provide a real edge, but it requires investing time to develop. It’s not a system that generates profit the moment you learn the patterns.
Price Action Trading with Moving Averages and Indicators — Can They Work Together
Many people believe that price action means you must never use any indicator. That is a misconception.
The truth is that certain indicators can serve as “support tools” without creating dependency. For example:
- Moving average (MA): Use as dynamic support/resistance or to identify trend direction — but not as a buy/sell signal
- Volume: If your platform has volume data, it can be excellent for confirming breakouts
- ATR (Average True Range): Use to calculate stop loss size based on actual volatility
What you should avoid are heavily lagging indicators like RSI, MACD, and Stochastic — when used to “confirm,” they often arrive too late and the entry point is already gone.
Setting Stop Loss, Take Profit, and Risk Management with Price Action
| Component | Approach | Reasoning |
| Stop Loss | Place behind a logical structure with buffer | Avoid stop hunts |
| Take Profit | R:R of at least 1:2, or at the next resistance/support | Ensures the system is profitable long-term even with low win rate |
| Position Size | No more than 1–2% of capital per trade | Keeps the account alive during losing streaks |
| Number of Positions | No more than 3–5 simultaneous positions | Diversify risk, avoid overexposure |
Key principle: A 50% win rate with a 1:2 R:R ratio produces profit over the long term. You don’t need to be right on every trade — just manage winning trades better than losing ones.
Price Action Summary — How to Start on the Right Path
Price action is one of the most powerful methods of market analysis, but it takes time to build. There are no shortcuts.
Trading with price action requires building your own methodology first — not just knowing the patterns.
Recommended learning sequence:
- Start with market structure — uptrend, downtrend, sideways
- Learn support/resistance as zones, not lines
- Practice reading 4–5 basic candlestick patterns first — no need to memorize all 12 at once
- Make top-down analysis a routine
- Backtest on TradingView’s replay feature before live trading
Recommended learning resources:
| Tool | What It’s Used For | Cost |
| TradingView | Charts, replay, community | Free / $12.95–$49.95/month |
| MT4/MT5 | Live trading, EAs, backtesting | Free |
| BabyPips | Learn forex fundamentals | Free |
| Al Brooks — Trading Price Action | In-depth learning | Book ~$50 |
Frequently Asked Questions About Price Action
What is price action and how does it differ from technical analysis?
Price action is a subset of technical analysis, but it focuses on reading price directly without relying on indicators for signals. Most traders who use technical analysis depend on indicators like RSI or MACD, while price action traders read purely from market structure and candlestick patterns.
What does PA mean in trading?
PA is an abbreviation for Price Action in the trading community. A PA trader is someone who analyzes and makes trading decisions by reading price behavior directly from the chart, without using indicators as entry/exit signals.
What is price action trading?
Price action trading is making buy or sell decisions based primarily on candlestick chart patterns, market structure, and support/resistance levels — without waiting for signals from any indicator.
What is PA trading in gold?
PA trading in gold (XAU/USD) means applying price action principles to gold trading. Gold has the same price structures and candlestick patterns as forex, but with higher volatility and wider spreads. A key consideration is that stop losses must be wider than for regular currency pairs.
Can price action be used with crypto?
Yes. The same principles work across all markets. However, crypto has much lower liquidity than forex, which means false breakouts and liquidity grabs occur more frequently. Using higher timeframes (H4, Daily) tends to produce better results for crypto.
What is the best timeframe for price action?
There is no universal answer, but the principle is: use higher timeframes for context (Daily, H4) and smaller timeframes to find entry points (H1, M15). Starting with Daily and moving down to H4 is a classic and effective combination.
Is price action alone enough without any indicators?
It’s sufficient for signal analysis, but certain indicators can complement it without adding complexity — such as moving averages for trend direction or ATR for setting stop losses based on volatility. The key point is that indicators are support tools, not signal sources.
How is price action better than indicators?
Price action provides faster signals because there is no lag and helps you understand “why” price is moving, not just “when” an indicator tells you to buy or sell. However, the trade-off is higher subjectivity and the need for more screen time.
You may also be interested in these publications: