
| Broker | Offer | Minimum Deposit | Trade Now |
|---|---|---|---|

|
Assets: 300+
Min. Trade: $1 Payout: 100% Payout within 3 days |
$10
|
Trade Now |

|
Assets: 300+
Min. Trade: $1 Payout: 100% Payout within 3 days |
$10
|
Trade Now |

|
Assets: 300+
Min. Trade: $1 Payout: 100% Payout within 3 days |
$10
|
Trade Now |

|
Assets: 300+
Min. Trade: $1 Payout: 100% Payout within 3 days |
$10
|
Trade Now |
At Th-Option I have been using indicators for years in forex trading, and I still remember the early days: opening TradingView and seeing a screen full of coloured lines without knowing what any of them meant. Here is the straight version: which indicators I actually use, why, and how to read each one accurately.
What Is an Indicator: Meaning and Types of Indicators in Forex
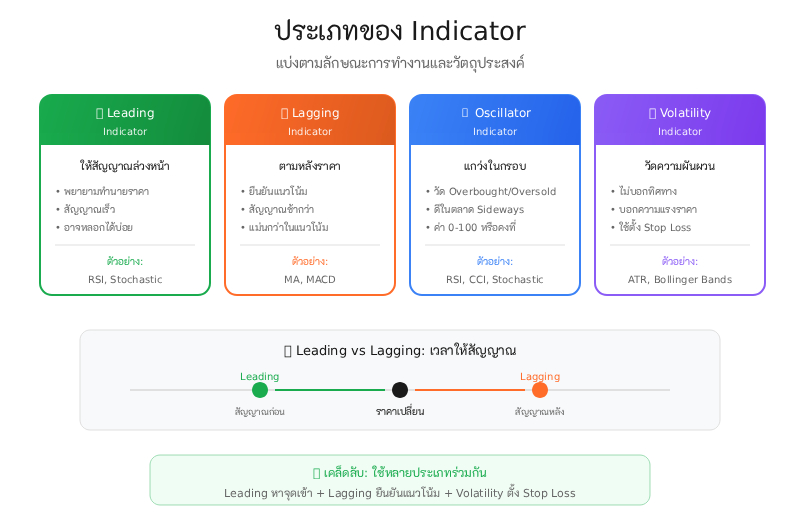
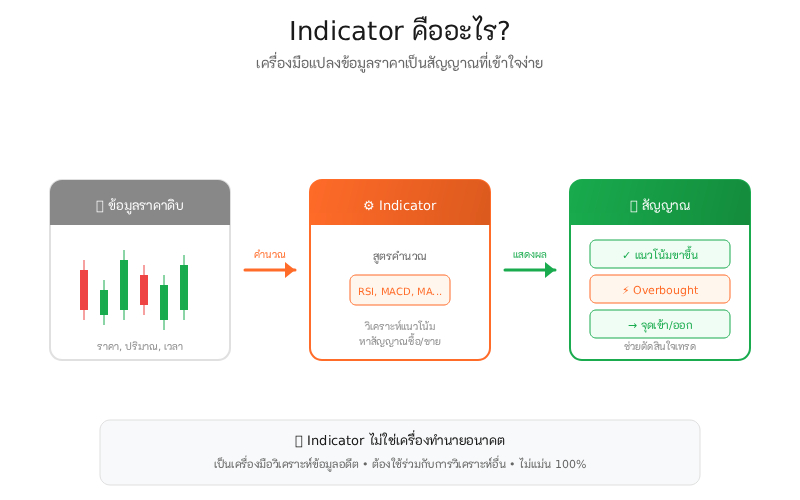
An indicator is a mathematical calculation based on market data, plotted on the chart to help you analyse the market. Indicators do not “predict” the future; they point to potential entry and exit areas based on how price has behaved in the past. Once you accept that distinction, you start using them far more effectively.
Forex trading indicators fall into two main groups: leading indicators, which signal before price moves, and lagging indicators, which confirm a move after the market has already started (MACD and Moving Average, for example). Both have strengths and weaknesses, and using the two types together filters out false signals much better than relying on a single tool.
Types of Indicators: Trend, Momentum, Oscillator, Volatility and Volume
Before choosing an indicator, you need to understand what each type actually measures:
- Trend indicator: shows market direction, whether it is up, down or sideways. Examples: Moving Average, ADX
- Momentum indicator / Oscillator: measures the strength of the move and shows overbought or oversold conditions
- Volatility indicator: measures how much price is moving, for example Bollinger Bands (BB) and ATR
- Volume indicator: shows buying and selling pressure through tools such as On-Balance Volume
| Indicator | Type | Default settings | Best timeframe | Main signal | Works best in |
|---|---|---|---|---|---|
| RSI | Momentum | 14 periods | H1, H4 | 70 / 30 plus divergence | Range |
| MACD | Lagging | 12, 26, 9 | H1 and above | Line crossover plus histogram | Trending |
| ADX | Trend | 14 periods | H4, D1 | 20 / 25 / 50 levels | Used as a filter |
| Stochastic | Oscillator | 14, 3, 3 | M5, M15 | %K crosses %D at 20/80 | Range |
| ATR | Volatility | 14 periods | Any timeframe | No direction, used to set SL | Every condition |
| Bollinger Bands | Volatility | SMA 20, dev 2 | M15 to H4 | Band touch plus squeeze | Range |
| Moving Average | Trend | EMA 9/21/50, MA 200 | Any timeframe | Golden / Death Cross | Trending |
| OBV | Volume | Cumulative | H4, D1 | Divergence against price | Every condition |
Default settings are a working starting point. There is no need to change them until you genuinely understand how that indicator behaves.
RSI (Relative Strength Index): The Most Popular Momentum Oscillator
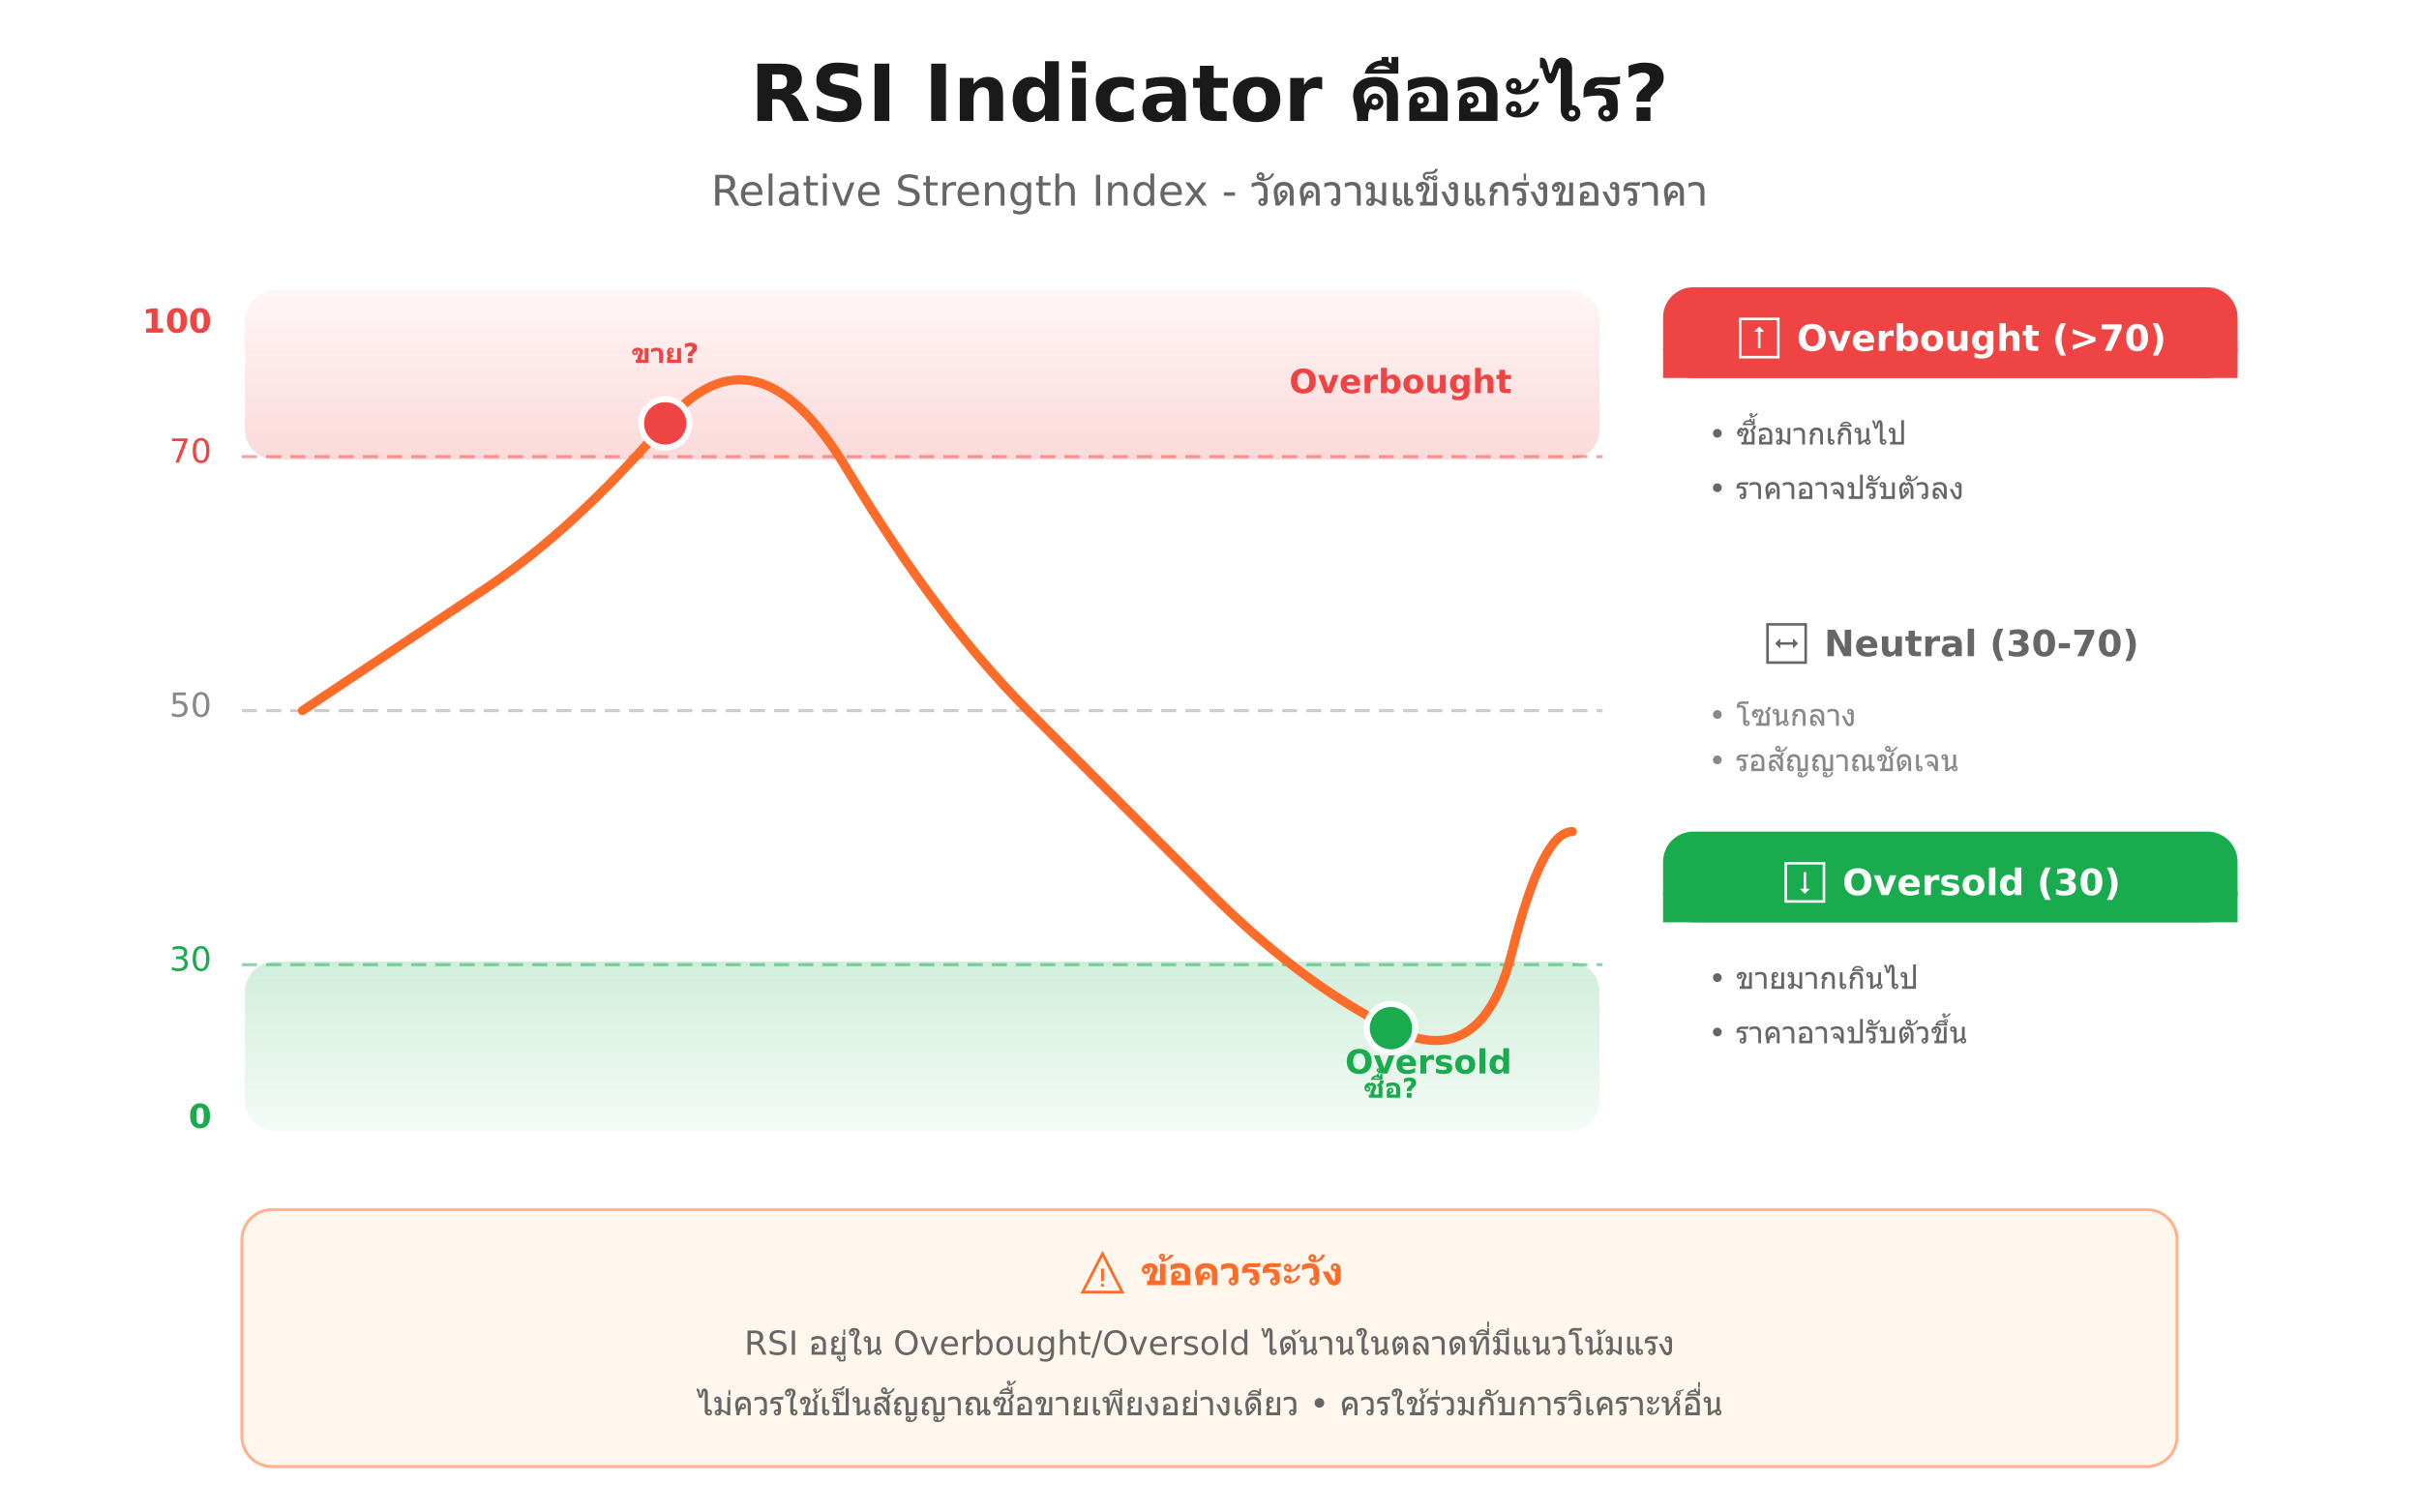
RSI is a momentum oscillator that measures the speed and size of price changes on a scale from 0 to 100, with a default setting of 14 periods.
How to read RSI:
- RSI above 70 = overbought, price may reverse downward, be careful about buying here
- RSI below 30 = oversold, price may reverse upward, start looking for a buy setup
- RSI crossing 50 from below = momentum is turning bullish
What I value far more than plain overbought/oversold readings is bullish divergence: when price makes a lower low but RSI makes a higher low, the downward momentum has weakened and a reversal often follows.
RSI or Stochastic, which should you use? RSI suits mid timeframes (H1, H4) better, while Stochastic reacts faster and fits shorter timeframes (M5, M15). Used together, agreement between the two produces a far more reliable signal.
MACD: A Trend Indicator With Momentum Built In
MACD consists of three parts: the MACD line (EMA 12 minus EMA 26), the signal line (EMA 9 of the MACD line) and a histogram showing the distance between the MACD line and the signal line.
Signals I actually use:
- MACD line crossing the signal line: a cross from below is a buy signal; a cross from above is a sell signal
- Histogram: rising positive bars mean strong bullish momentum; falling or negative bars mean bearish momentum
- MACD combined with Moving Average: if MACD is bullish and price sits above the MA 200, that is a strong buy signal
One caution: MACD is a lagging indicator, so its signals arrive later than RSI. It is at its best confirming direction, not finding entries on its own.
ADX (Average Directional Index): Measure Trend Strength Before Using Any Other Indicator
ADX is the indicator most traders overlook, and the one I consider most important, because it tells you whether the market is trending at all before you reach for anything else.
The ADX indicator has three lines: ADX (trend strength), +DI (upward directional indicator) and -DI (downward).
How to read ADX:
- ADX below 20: the market is sideways with no clear trend, be careful using trend indicators
- ADX above 25: a trend is forming, you can start trading with it
- ADX above 50: the trend is very strong and may be approaching exhaustion
- +DI above -DI with ADX above 25 = uptrend; -DI above +DI with ADX above 25 = downtrend
I always use ADX as a filter first. If ADX is below 20 I ignore signals from MACD or Moving Average entirely, because a ranging market produces a huge number of false signals.
Stochastic Oscillator: Finding Overbought and Oversold in a Sideways Market
Stochastic measures the most recent closing price against the high-low range over a set period. It has two lines: %K (the fast main line) and %D (a moving average of %K).
Main signals:
- %K crossing %D from below inside the oversold zone (under 20) = buy
- %K crossing %D from above inside the overbought zone (over 80) = sell
- Stochastic suits ranging markets and is not suited to strongly trending conditions
A practical tip: use Stochastic on a lower timeframe (M5-M15) to confirm an RSI signal from H1 and above. When both agree, reliability rises noticeably.
ATR (Average True Range): The Volatility Indicator for Setting Stop Loss
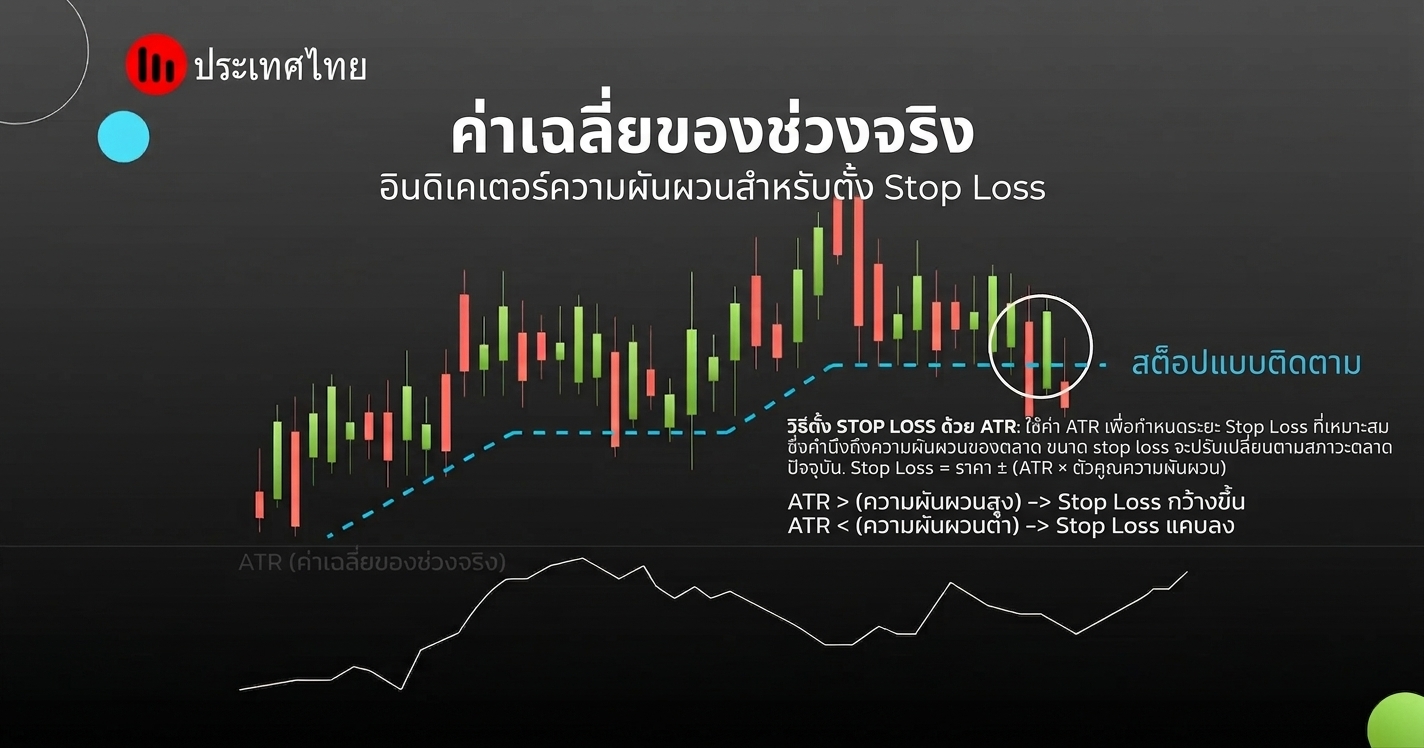
ATR is a volatility indicator that measures the average size of price movement over a set period. It shows no direction, only how much the market is moving.
What ATR is used for:
- Setting a sensible Stop Loss: if the ATR of EUR/USD on H4 is 30 pips, a 10-pip stop makes no sense because it will be swept out almost immediately
- Assessing risk per trade: high ATR = high volatility = reduce your lot size
- Setting Take Profit: targeting 1.5 to 2 times ATR is a realistic take profit level
The formula I use: Stop Loss = ATR × 1.5. That anchors the stop to actual market behaviour instead of an arbitrary number.
Bollinger Bands (BB): A Volatility Indicator That Marks Buy and Sell Entries
Bollinger Bands consist of three lines: the Middle Band (SMA 20) and Upper/Lower Bands sitting two standard deviations away from it. Roughly 95% of price action stays inside the bands.
Using the BB indicator:
- Price touching the Lower Band with RSI oversold = buy signal in a ranging market
- Price touching the Upper Band with RSI overbought = sell signal
- Narrow bands (a squeeze) = low volatility, a strong breakout is close
- Very wide bands = high volatility, do not enter yet, wait for a pullback
The mistake I see most often: using BB to buy when price touches the lower band during a strong downtrend. Bollinger Bands do not tell you to trade against the trend automatically. Check ADX first to confirm whether a trend exists.
Moving Average (MA): The Trend Indicator Everyone Watches
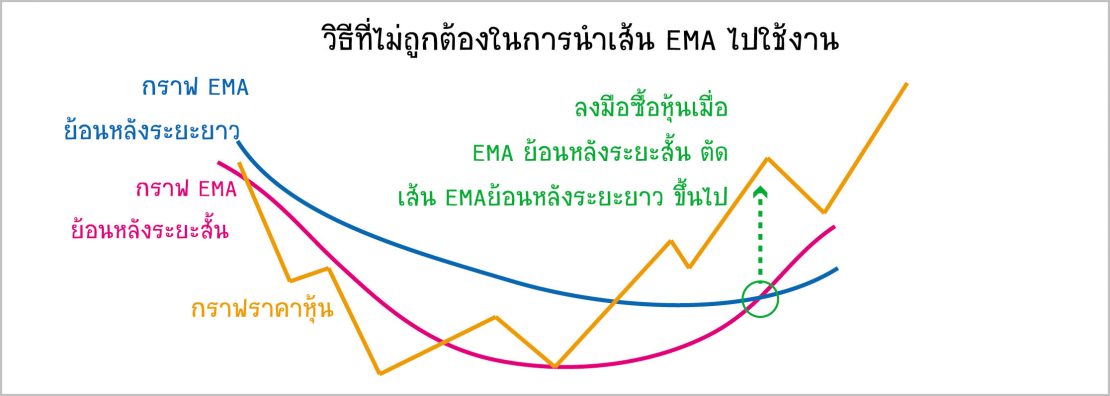
Moving Averages come in two main types: SMA (Simple Moving Average), which weights every period equally, and EMA (Exponential Moving Average), which weights recent prices more heavily and therefore reacts faster.
The MAs most used in forex:
- EMA 9, 21: short-term momentum, used on M15-H1
- EMA 50: mid-term trend. Price above EMA 50 = uptrend
- MA 200: the major trend, and the line institutions and hedge funds watch most closely. Price above it = bullish
Golden Cross: EMA 50 crossing MA 200 from below = long-term buy signal. Death Cross: crossing from above = long-term sell signal.
What Type of Indicator Is Fibonacci Retracement, and How to Use It
Fibonacci Retracement is a special category that people often ask about. Strictly speaking it is a tool rather than a calculated indicator: it draws support and resistance levels from a swing high-low using mathematical ratios (23.6%, 38.2%, 50%, 61.8%, 78.6%).
How to use it in practice:
- Draw the Fibonacci from swing low to swing high (in an uptrend)
- Wait for price to pull back to the 38.2%, 50% or 61.8% level
- Confirm with RSI oversold or a bullish candle pattern at that level
- Enter long with a stop loss below the 61.8% level (or 78.6% if the trend is strong)
OBV (On-Balance Volume): The Volume Indicator That Shows Real Buying Pressure
OBV is a volume indicator that accumulates buying and selling pressure according to price direction. If the close is higher than yesterday, volume is added; if lower, it is subtracted. The result shows whether money is flowing into or out of the market.
The signal worth watching: if price makes a lower low but OBV makes a higher low (divergence), buying pressure is accumulating while price only appears to be falling. An upward reversal often follows.
The Best Forex Indicators: How to Combine Them Effectively
No single indicator is best for everyone. What works best is combining indicators that complement rather than duplicate each other. These are the combinations I use:
Combination 1 , Trend Trading (H4-D1):
ADX (filter out ranging markets) + EMA 50/200 (identify the trend) + MACD (confirm momentum) + ATR (set the stop loss)
Combination 2 , Range Trading (M15-H1):
ADX below 20 + Bollinger Bands (find the range boundaries) + Stochastic (check oversold) + RSI (confirm)
Combination 3 , Breakout Trading:
Bollinger Squeeze (wait for low volatility) + rising ATR + OBV (confirm real buying pressure) + ATR (size the expected move)
| Indicator | Trending market | Ranging market | Breakout phase | High-impact news | Primary role |
|---|---|---|---|---|---|
| ADX | ✓ Excellent | ✓ Confirms a range | ✓ Catches new trends | Reacts slowly | First filter |
| Moving Average | ✓ Excellent | ✗ Many false signals | Too slow | ✗ Cannot keep up | Find direction |
| MACD | ✓ Excellent | ✗ Many false signals | Confirms after the break | ✗ Lags badly | Confirm momentum |
| RSI | Can stay pinned in a zone | ✓ Excellent | ✗ Frequently misleading | ✗ Spikes to extremes | Spot reversals |
| Stochastic | ✗ Unsuitable | ✓ Best in class | ✗ Frequently misleading | ✗ Should not be used | Overbought / oversold |
| Bollinger Bands | Price can ride the band | ✓ Excellent | ✓ Squeeze warns early | Bands expand fast | Measure volatility |
| ATR | ✓ Works | ✓ Works | ✓ Works | ✓ Most important here | Set SL / size trades |
| OBV | ✓ Confirms trend | Signals unclear | ✓ Confirms real pressure | ✓ Shows money flow | Volume confirmation |
Note that ATR is the only indicator that works across every market condition, precisely because it gives no directional signal. It measures volatility, and volatility is always present.
How to Use Indicators on TradingView, MetaTrader 4 and MetaTrader 5
TradingView is the platform I recommend for analysis because every indicator mentioned here is built in. It is free to use and supports every forex pair.
Adding an indicator in TradingView:
- Click "Indicators" in the top toolbar
- Search for the indicator name, for example "RSI" or "MACD"
- Click to add it and the indicator appears on the chart immediately
- Click the gear icon to adjust the settings as needed
For MT4 and MT5, most indicators are already built in. Go to Insert → Indicators → choose the category. Beyond that there are thousands of custom indicators available for download from the MQL5 marketplace.
Brokers with direct TradingView support include OANDA, Pepperstone, IC Markets and XM, while MetaTrader 4 and MT5 are supported by almost every broker.
Common Mistakes When Using Indicators and Price Action
- Using too many indicators: a chart packed with lines only creates confusion about whether to buy or sell. Three or four complementary tools beat ten overlapping ones
- Using the wrong indicator for the market condition: MACD in a ranging market produces a flood of false signals. Always check ADX first
- Ignoring price action: every indicator is calculated from price, so price action on a clean chart always matters more than the indicator itself
- Not adapting the stop loss to volatility: use ATR to measure volatility and set a stop that reflects it, rather than a fixed number
Summary: Choose the Indicator That Fits Your Trading Style and Timeframe
There is no single best forex analysis tool for everyone, but there is one that suits each style:
- Trend trader: EMA 50/200 + MACD + ADX combo
- Range trader: Bollinger Bands + RSI + Stochastic
- Scalper: short EMAs (9, 21) + Stochastic + ATR
- Swing trader: Fibonacci Retracement + a momentum combo + OBV
Using indicators correctly starts with understanding how each one works, not just watching for lines to cross. Always test on a demo account before applying anything live, using leverage you can actually manage. There are no shortcuts in forex trading.









Leave A Comment