| Broker | Offer | Minimum Deposit | Trade Now |
|---|---|---|---|
|
|
Assets: 300+
Min. Trade: $1 Payout: 100% Payout within 3 days |
$10
|
Trade Now |
|
|
Assets: 300+
Min. Trade: $1 Payout: 100% Payout within 3 days |
$10
|
Trade Now |
|
|
Assets: 300+
Min. Trade: $1 Payout: 100% Payout within 3 days |
$10
|
Trade Now |
|
|
Assets: 300+
Min. Trade: $1 Payout: 100% Payout within 3 days |
$10
|
Trade Now |
Technical analysis offers numerous tools to help traders predict price direction more accurately. One very popular tool among professional traders is the Harmonic Pattern, which uses the Fibonacci ratio to identify high-probability price reversal points. The Th-Option team has thoroughly studied and compiled information about this pattern to help you understand its principles and apply them effectively in your trading.
Introduction to Harmonic Patterns
Harmonic Patterns are one of the most complex yet highly accurate technical analysis methods. This tool is developed based on the mathematical relationship between the Fibonacci ratio and price movements in financial markets. Skilled traders using balanced patterns can accurately identify entry and exit points, enabling them to manage risk and maximize profit opportunities effectively.
What are Harmonic Patterns in Technical Analysis?
Harmonic patterns are price patterns with a unique structure that precisely correlates with Fibonacci ratios according to mathematical principles. These patterns help traders identify high-probability reversal points in advance. Their use requires an understanding of the X-A-B-C-D structure and accurate measurement of the ratios according to established criteria. Unlike other technical analysis methods, Harmonic Patterns have clear and measurable rules, greatly reducing subjectivity in pattern interpretation. Traders can use this tool to find high-probability entry points and systematically determine Stop Loss and Take Profit points.
Main Concept and Origin (Fibonacci and X-A-B-C-D Structure)
The concept of balanced patterns originates from the discoveries of H.M. Gartley in 1935, published in his book “Profits in the Stock Market,” and was further developed by Scott Carney, who later defined precise Fibonacci ratios for each pattern. The basic structure of a symmetrical pattern consists of five main points: X, A, B, C, and D. Each leg of the pattern must have a ratio corresponding to a predetermined Fibonacci value, such as 0.382, 0.500, 0.618, 0.786, 0.886, 1.272, and 1.618, etc.
The importance of the X-A-B-C-D structure lies in the fact that the price must move strictly according to the specified proportions. If the ratios do not meet the specified criteria, the pattern is considered incomplete and should not be used for trading decisions. A thorough understanding of this structure will help traders accurately identify the pattern and avoid potential false signals.
Why Trading with Harmonic Patterns Differs from Other Chart Patterns
Harmonic patterns differ significantly from typical chart patterns in that they use Fibonacci ratios to determine and confirm the pattern’s validity. Other chart patterns, such as Head and Shoulders, Double Top, Triple Bottom, or Triangle, rely primarily on visual identification, which can lead to differing interpretations among traders.
The key advantages of cohesive patterns are numerous. Firstly, they have clear and measurable entry and exit points. Secondly, Stop Loss and Take Profit can be accurately determined mathematically. Thirdly, they offer a good risk-reward ratio because they can be calculated in advance. And finally, they greatly reduce subjectivity in interpretation because they have clear numerical criteria.
Appearance of a Harmonic Pattern Chart on a Price Chart
When viewed on a price chart, a harmonic pattern chart resembles the letter M or W, depending on whether it’s a bullish or bearish pattern. Each point of the pattern is connected by lines that clearly show price movement. Identifying patterns requires the use of Fibonacci Retracement and Fibonacci Extension tools to confirm that the ratios of each leg are correct according to the criteria set for that particular pattern.
A key feature of structured patterns on a chart is that point D is the most important point, as it is a Potential Reversal Zone (PRZ), or a zone where the price has a high chance of reversing. Traders wait for the pattern to be complete at point D before entering a trade in the predicted direction.
Mechanism of Harmonic Patterns
A deep understanding of the mechanism will help you use structured patterns more effectively. The basic principle lies in the mathematical relationship between price movement and Fibonacci ratios, a sequence of numbers found in the nature and behavior of financial markets.
Fibonacci Ratios and Price Structure
There are several important levels of Fibonacci ratios commonly used in balanced patterns. Each level has a different meaning and usage as follows:
| Ratio | Type | Main Usage |
| 0.382 | Retracement | Shallow retracement, used in Bat Pattern |
| 0.500 | Retracement | Medium retracement |
| 0.618 | Retracement | Golden Ratio Most frequently used |
| 0.786 | Retracement | Deep retracement, used in Gartley |
| 0.886 | Retracement | Very deep retracement, used in Bat |
| 1.272 | Extension | First level extension |
| 1.618 | Extension | Golden Extension |
| 2.618 | Extension | Distance Extension |
Each balanced pattern has a specific ratio assigned to each leg. For example, in the Gartley Pattern, leg AB must be 0.618 of leg XA, and leg CD must be 1.27-1.618 of leg BC, and so on. A thorough understanding of these ratios helps in accurately identifying the patterns.
Reasons why Harmonic patterns work
Symmetrical patterns work in the financial markets because they are based on market behavior that often repeats in similar ratios. The main reason these patterns are effective is that many institutional investors, funds, and trading algorithms use Fibonacci levels in their trading decisions, making these levels self-fulfilling prophecies.
Furthermore, the Fibonacci Ratio is a ratio found in nature and human behavior. This is reflected in the price movements in financial markets, which are driven by investor psychology.
Important Harmonic Patterns
There are many types of harmonic patterns that are recognized in the trading world. Each pattern has its own characteristics and different Fibonacci ratios. Learning the main patterns in detail will help you identify more and diverse trading opportunities.
ABCD pattern
The ABCD pattern is the most basic and the foundation of other patterns. It consists of 4 points, with legs AB and CD of equal length. Leg BC is 0.618 or 0.786 of AB, and leg CD is 1.272 or 1.618 of BC. This pattern is suitable for beginners because it is easy to identify.
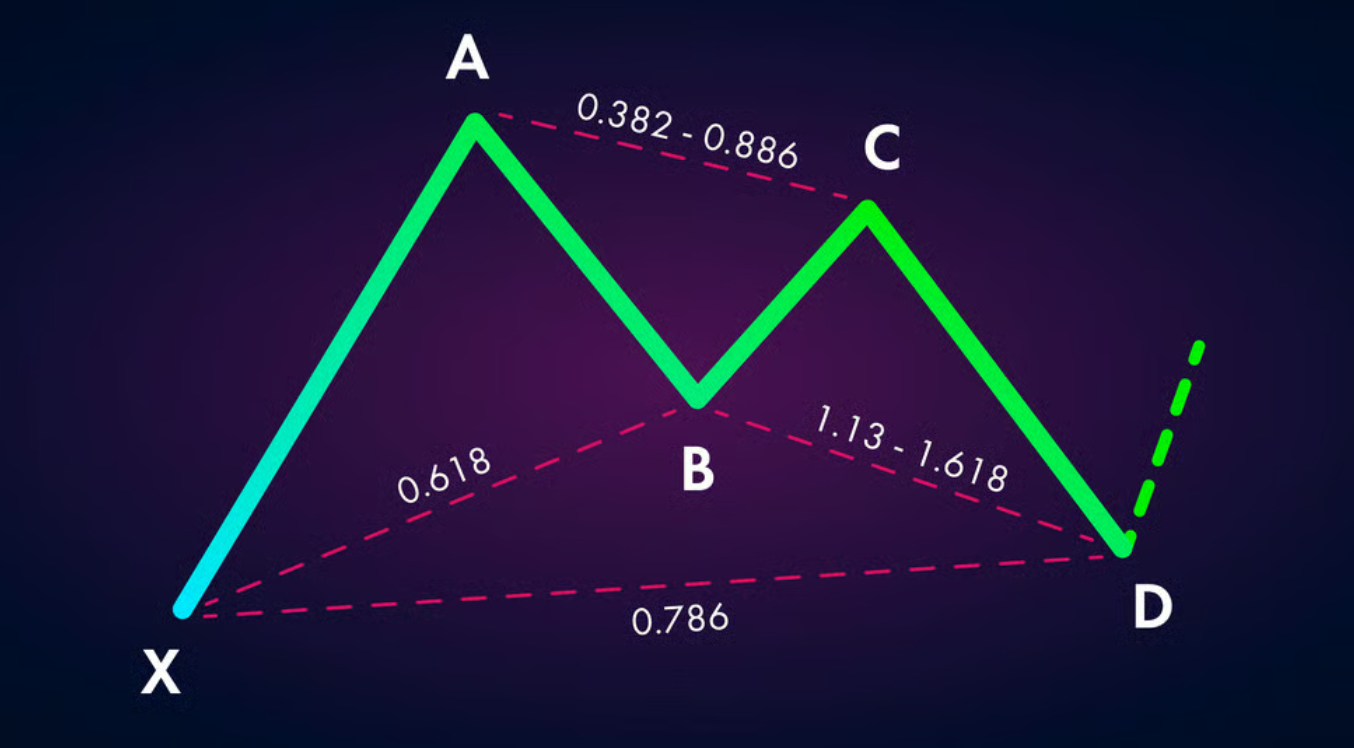
Gartley pattern
The Gartley pattern was discovered by H.M. Gartley in 1935. Its key features are that point B is at 0.618 of XA, point C is at 0.382-0.886 of AB, and point D is at 0.786 of XA. This pattern often provides accurate signals in markets with a clear trend.
Bat Pattern
Developed by Scott Carney, the Bat Pattern is similar to the Gartley Pattern but has a deeper D point at 0.886 of XA. It is renowned for its excellent risk-reward ratio.
Butterfly Pattern
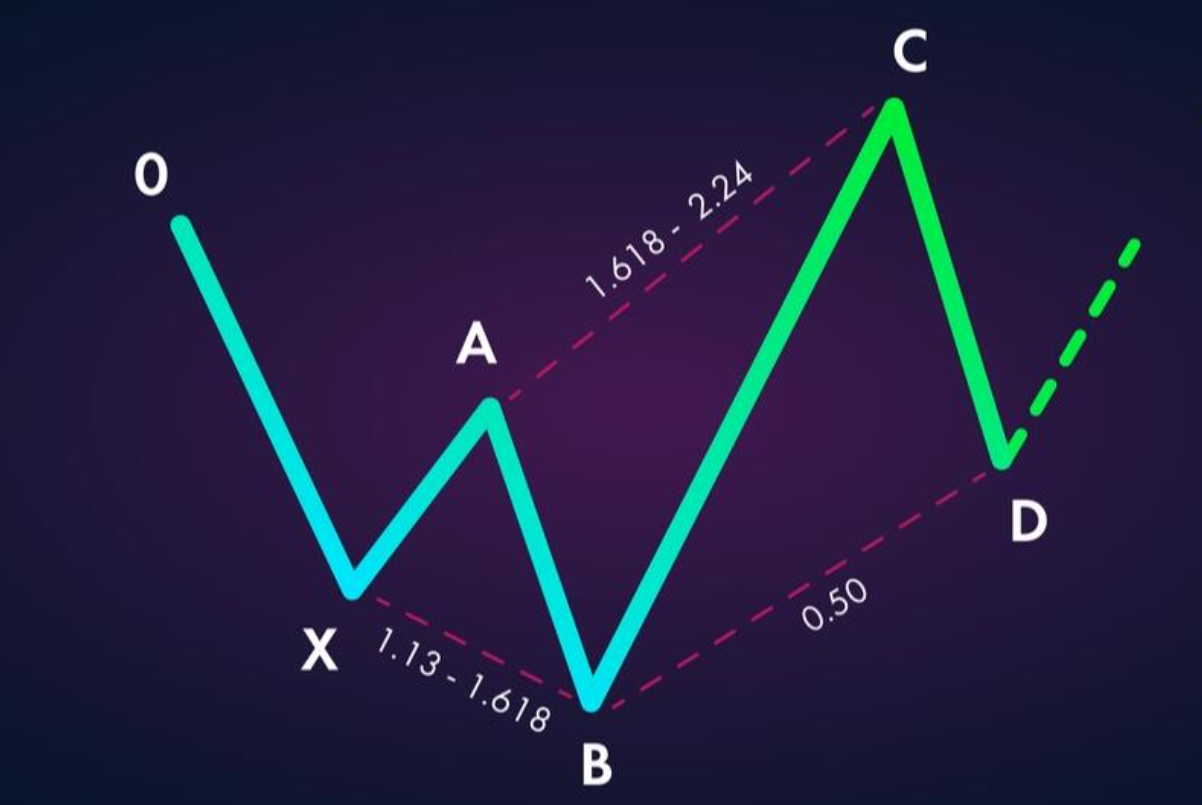
The Butterfly Pattern is unique because its D point is outside the X point, at 1.272-1.618 of XA. This pattern often occurs at the end of a major trend.
Crab and Deep Crab Pattern
The Crab Pattern has the furthest extension, with its D point at 1.618 of XA for a regular Crab or 2.618-3.618 for a Deep Crab. It offers high profit potential but caution is needed regarding stop-loss orders.
Shark Pattern
The Shark Pattern is a newer pattern with a different structure, using an O point instead of an X point. It is suitable for highly volatile markets.
Other Harmonic Patterns (Cypher, 5-0)
For example)
In addition to the main patterns, there is also the Cypher Pattern at point D of 0.786 of XC and the 5-0 Pattern used after other patterns fail. When asked how many types of harmonic patterns there are, the answer is that there are more than 10 recognized patterns.
How to Identify Harmonic Patterns
Accurately and precisely identifying consistent patterns requires the right tools and a systematic process. This section will explain how to help you identify patterns effectively.
Tools and Indicators Used
The essential tools for identifying consistent patterns are: Fibonacci Retracement Tool for measuring price retracements, Fibonacci Extension Tool for measuring price extensions, correlated pattern scanner or automatic indicator to help identify patterns, ZigZag Indicator to help identify swing high and swing low points, and the XABCD Pattern Tool which is available on many trading platforms.
Most trading platforms such as MetaTrader and TradingView have these tools built-in, or you can install additional indicators for free.
Harmonic Pattern Confirmation Process
The confirmation process is crucial and must be done systematically as follows:
Step 1: Identify points X and A by finding clear Swing High and Swing Low points on the chart. Step 2: Wait for point B to form and confirm that B is within the correct Retracement ratio of XA. Step 3: Confirm point C by checking that the Retracement of AB is within the specified range. Step 4: Wait for point D, which is a potential entry point. Check both the Retracement of XA and the Extension of BC. Step 5: Confirm with Confluence using Support/Resistance, Trend Lines, or other indicators to increase confidence.
How to Use Harmonic Patterns for Beginners
For beginners who want to know how to use harmonic patterns correctly, here are some important recommendations: Start by studying simple patterns such as ABCD and Gartley before moving on to more complex patterns. Practice identifying patterns on historical charts to build familiarity before trading live. Use a demo account to practice real trading without risking real money. Don’t rush into trades until the pattern is complete at point D, and always set a stop loss on every trade.
Appropriate Timeframe and Trading Context
Choosing the right timeframe greatly affects the success of trading with balanced patterns. Each timeframe has different advantages and disadvantages that must be considered according to each person’s trading style.
Harmonic Pattern PDF (Thai)
For those who want a reference document for self-study, harmonic pattern PDFs (Thai) can be found from various sources, such as trading websites in Thailand, investment forums, and various online educational platforms. These PDF documents often include all the patterns along with the correct Fibonacci ratios and clear examples, making them suitable for review and study at any time.
Timeframe
Best for Harmonic Patterns
We have prepared a table to help you understand the information.
Trader
| Timeframe | Advantages | Disadvantages | Suitable for |
| M15-M30 | Frequent trading opportunities | High noise, may have false signals | Scalper |
| H1 | Balanced | Requires frequent monitoring | Day Trader |
| H4 | Clear signal, low noise | Requires a considerable amount of waiting time | Swing |
| Daily | Highly accurate | Takes a long time for patterns to form | Position Trader |
| Weekly | Suitable for long-term investment | Very few trading opportunities | Investor |
Reasons why Timeframe matters
Higher timeframes tend to provide more accurate signals because they have less noise than lower timeframes. However, using a high timeframe means having to wait longer for patterns to complete and fewer trading opportunities. Therefore, the choice of timeframe should be based on individual trading style, available time, and patience level.
Recommendations for choosing
Timeframe
General guidelines for selecting a timeframe for symmetrical patterns are as follows: Scalpers should use H1 or M30, but beware of false signals; Day traders should use H1-H4, which provides a good balance; Swing traders should use H4-Daily for clearer signals; and Position traders should use Daily-Weekly for long-term trading.
A recommended technique is to analyze from higher timeframes down to lower timeframes to get an overview of the market first, and then look for entry points on lower timeframes.
Using Harmonic Patterns in Various Markets
Cohesive patterns can be used in many financial markets, each with its own characteristics that may require adjustments to their application.
Harmonic Patterns in the Forex Market
The Forex market is the most suitable market for using Harmonic Patterns for several reasons: it has very high liquidity, allowing prices to move smoothly; it is open 24 hours a day, 5 days a week, providing trading opportunities at any time; it offers a wide variety of currency pairs to choose from; and it has low spreads, keeping trading costs low. Major currency pairs such as EUR/USD, GBP/USD, and USD/JPY often provide clear and accurate harmonic patterns.
Harmonic Patterns in the Crypto Market
The crypto market is much more volatile than other markets, requiring extra caution when using structured patterns. Recommendations for trading balanced patterns in the crypto market include: using higher timeframes such as H4 or Daily to reduce noise; setting wider stop losses to accommodate volatility; being cautious when trading during major news releases or high volatility; and being suitable for patterns with significant extensions, such as the Crab Pattern.
Harmonic Patterns in the Stock Market
In the stock market, harmonic patterns can perform just as well as in other markets. Considerations include: being suitable for stocks with high trading volume because prices move better according to technical analysis; using Daily or Weekly timeframes for clearer signals; being cautious during earnings announcements or important company news; and being good for finding entry points in stocks you are already following.
Common Mistakes in Using Harmonic Patterns
Learning from the mistakes of others can help you avoid unnecessary losses. This section compiles common errors and their solutions.
Errors in Identifying Patterns
The most common errors in identifying patterns are: forcing patterns to occur even when the Fibonacci ratio does not meet the criteria (it must be acknowledged that not all patterns are perfect), confusing different patterns such as Gartley and Bat (the ratio of point D must be carefully checked), not waiting for the pattern to complete before entering a trade (patience is needed for point D), and neglecting the overall market context (the larger trend must also be considered).
Errors in Interpretation
Faults in using Fibonacci
Common mistakes in using Fibonacci include: using incorrect points X and A (clear Swing High/Low should be selected), disregarding tolerance or acceptable error values of the ratio, not using Fibonacci Extension in conjunction with Retracement for confirmation, and being too fixated on the numbers without considering other contexts.
How to Avoid False Signals
There are several ways to prevent false signals: wait for confirmation from Price Action at point D, such as a Reversal Candlestick Pattern, use Confluence from other indicators such as RSI, MACD, or Moving Average, check if Volume has increased at point D, use a higher timeframe to confirm the direction, and avoid trading during important news events that may cause abnormal price volatility.
Resources on Harmonic Patterns
Continuous learning is key to success in trading with balanced patterns. Many resources are available to help improve your skills.
Harmonic Pattern Books
For those who want to study harmonic patterns in depth, highly recommended books include: “Harmonic Trading Volume One” and “Harmonic Trading Volume Two” by Scott Carney, a world-renowned balanced pattern expert; “Profits in the Stock Market” by H.M. Gartley, the original book introducing the Gartley Pattern; and “The Harmonic Trader” by Scott Carney as well. These books are primary references for correctly studying symmetrical patterns.
Courses and PDF Documents
Numerous online learning resources are readily available: free courses on YouTube from various professional traders, PDF documents from trading websites and forums, webinars from brokers who often offer free training to clients, and forums and communities for exchanging knowledge and experience.
Online Tools for Pattern Recognition
There are many tools that help to automatically identify patterns: TradingView Structured Pattern Indicator, which is free on the TradingView platform; MetaTrader Harmonic Scanner for MT4/MT5 users; AutoChartist, available from many brokers; and other third-party pattern recognition software. These tools can save a lot of time and reduce errors in pattern identification.
Frequently Asked Questions (FAQ)
What is a Harmonic Pattern?
A Balanced pattern is a price pattern that uses Fibonacci ratios to identify high-probability price reversal points. It has a basic X-A-B-C-D structure, and each leg of the pattern must have a ratio that corresponds to a specific defined Fibonacci value. It is a tool that helps traders find accurate entry and exit points for trades.
How many types of Harmonic patterns are there?
There are about 7-10 main symmetrical patterns that are officially recognized, including the ABCD Pattern, Gartley Pattern, Bat Pattern, Butterfly Pattern, Crab Pattern, Deep Crab Pattern, Shark Pattern, Cypher Pattern, and 5-0 Pattern. Each pattern has different Fibonacci ratios and unique characteristics.
How to confirm a Harmonic pattern?
Confirming a cohesive pattern is done by checking that the Fibonacci ratio of each leg meets the criteria specified for that pattern. In addition, Price Action at point D should be used as further confirmation, such as waiting for a Reversal Candlestick Pattern to occur and looking for Confluence from other technical tools such as Support/Resistance or various Indicators.
Which Timeframe is best suited for Harmonic patterns?
H4 and Daily are the recommended timeframes for beginners and most traders. Because there’s a good balance between the number of signals and the accuracy of the patterns, lower timeframes may have more false signals, while higher timeframes may require too long a wait. The final timeframe choice depends on each individual’s trading style and available time.
You might also be interested in these additional publications: