| Broker | Offer | Minimum Deposit | Trade Now |
|---|---|---|---|
|
|
Assets: 300+
Min. Trade: $1 Payout: 100% Payout within 3 days |
$10
|
Trade Now |
|
|
Assets: 300+
Min. Trade: $1 Payout: 100% Payout within 3 days |
$10
|
Trade Now |
|
|
Assets: 300+
Min. Trade: $1 Payout: 100% Payout within 3 days |
$10
|
Trade Now |
|
|
Assets: 300+
Min. Trade: $1 Payout: 100% Payout within 3 days |
$10
|
Trade Now |
Trading by analyzing price behavior is a popular method among professional traders worldwide because it involves reading the market directly from price movements without relying on complex indicators. The Th-Option team has studied and compiled knowledge about the principles, key patterns, and step-by-step trading methods to help you understand and apply them effectively in real trading.
Meaning and Principles of Price Action
Analyzing price behavior is a fundamental aspect of trading in the Forex and other financial markets. This principle emphasizes reading and interpreting price movements through candlestick charts without the need for additional tools. Skilled traders can identify optimal entry and exit points by observing the behavior of buyers and sellers in the market. This method has been developed over decades and has proven effective in all market conditions.
What is Price Action / What is PA Forex
Price action is a method of market analysis that studies past and present price movements. This approach does not require any technical indicators. Traders read candlestick charts and identify patterns that indicate market trends. PA forex is the application of price behavior analysis principles specifically in the foreign exchange market. The basic principle is the belief that market prices reflect all available information, whether it be news, expectations, or the behavior of major investors.
Why is Price Action Popular in Forex
Price behavior analysis has gained popularity due to its simplicity and proven effectiveness. Traders don’t need to rely on complex calculation formulas or expensive software. Direct chart reading allows for quick and accurate decision-making. The Forex market has high liquidity, making price patterns clearly visible. Furthermore, this method can be applied to all timeframes and currency pairs. Another advantage is the reduced signal reception lag. Most indicators are calculated from historical data, causing signals to be delayed. In contrast, direct price analysis provides real-time information. Traders can immediately see changes in the balance between buying and selling pressure. Consistent practice will help develop better market reading intuition.
Core Concepts of Price Action (No Indicators + Support/Resistance)
The core concept of this analysis is believing that price already reflects all market information. Support and resistance levels are key elements traders use to identify points where price may stop or reverse. Not using indicators reduces signal reception lag; traders can see market behavior in real-time. Consistent practice observing support and resistance levels greatly improves chart reading skills.
Support levels are price levels where buying pressure often pushes the price down, causing it to stop or reverse upwards. Resistance levels are levels where selling pressure often pushes the price down, causing it to stop or reverse downwards. Accurately identifying these levels is a fundamental skill. Traders often use past highs and lows as references. Additionally, round numbers such as 1.1000 or 1.2500 are often used as psychological support and resistance levels.
Price Action Patterns and Structure
Understanding the structure of price movement is a fundamental skill for every trader. The various patterns that appear on candlestick charts provide information about the balance between buying and selling pressure. Recognizing and interpreting these patterns correctly will help predict price direction more accurately. Market structure consists of uptrends, downtrends, and sideways ranges.
What are Price Action Patterns / Price Action Candlestick Patterns
Price action refers to the arrangement of candlesticks that indicates potential future price movements. Price action candlestick patterns consist of one or more candlesticks exhibiting specific behavior. Learning the basic patterns will help traders read the market more effectively.
Price action patterns: Single candlestick patterns give signals from just one candlestick, such as a Pin Bar or Doji. Multi-candlestick patterns require two or more candlesticks to generate a signal, such as an Engulfing or Morning Star. The importance of the pattern depends on where it occurs and the overall market context.
Common Forex Candlestick Patterns
There are several types of forex candlestick patterns commonly used by traders. A Pin Bar is a candlestick with a long wick and a short body, indicating price rejection. An Engulfing occurs when one candlestick completely engulfs the previous one. An Inside Bar is a candlestick that is within the range of the previous one. A Doji indicates market uncertainty when the opening and closing prices are close together.
Bar
| Patterns | Characteristics | Signals |
| Pin Bar | Long Wick, Short Body | Price Rejection |
| Engulfing | Large Bar Swallows Small Bar | Reversal |
| Inside Bar | Bar is inside the previous bar | Consolidation |
| Doji | Close opens and closes | Uncertainty |
| Hammer | Long lower wick, body above | Bull reversal |
| Shooting Star | Long upper wick, body below | Downward reversal |
Learning these basic patterns is a great starting point for beginners. As you gain more expertise, you can expand your study to more complex patterns.
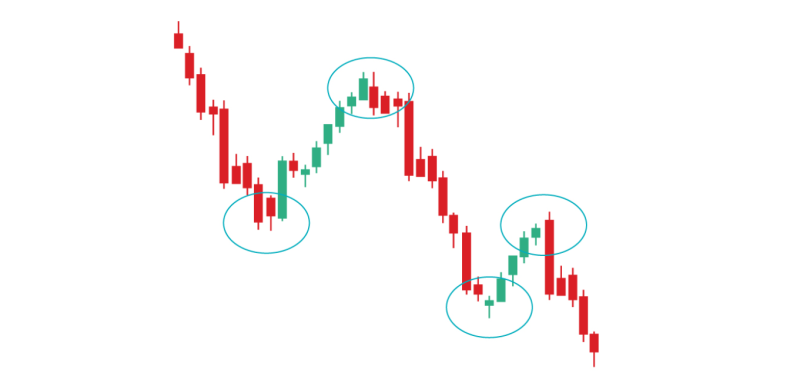
Price Action Reversal and Continuation Patterns
Price action reversals are patterns that indicate that the current trend is about to end and the price will change direction. Examples include Double Top and Double Bottom or Head and Shoulders. Continuation patterns indicate that the current trend will continue after a consolidation period, such as Flag and Triangle. Distinguishing between these two types is important in planning your trades.
Reversal patterns often occur after long trends and usually appear at key support and resistance levels. Traders should wait for confirmation before entering a trade because the pattern may fail. Continuation patterns usually occur in the middle of a trend when the market consolidates before continuing its movement. Trading based on continuation patterns often has a good risk-to-profit ratio.
Popular Price Action Patterns in Forex
Learning popular patterns will help traders quickly identify trading opportunities. Each pattern has a different meaning and application. Practicing and memorizing these patterns on real charts will continuously improve analytical skills. Trading success doesn’t depend on knowing many patterns, but on using the patterns you know effectively.
What are Price Action Patterns and How to Use Them in PA Forex
Price action patterns are recurring candlestick patterns that are statistically significant in the market. These patterns are used to identify high-probability entry and exit points. Traders wait for the pattern to fully form before deciding to open a position. Confirmation with trading volume and support and resistance levels increases accuracy.
The application process begins with identifying the main market trend, then finding patterns that align with the trend. Wait for the pattern to complete and be confirmed. Clearly define entry points, Stop Loss, and Take Profit. Finally, manage the position according to the plan.
12 Price Action Patterns You Should Know (Including Reversal and Trend Patterns)
The 12 Price Action patterns that traders should know include the following important patterns:
| Order | Format | Type | Description |
| 1 | Pin Bar | Reversal | Long wick indicating price rejection |
| 2 | Bullish Engulfing | Upward Reversal | Green bar engulfs red bar |
| 3 | Bearish Engulfing | Downward Reversal | Red bar engulfs green bar |
| 4 | Inside Bar | Continuation / Reversal | Bar within the previous bar’s range |
| 5 | Outside Bar | Reversal | Bar covering the previous bar |
| 6 | Doji | Uncertain | Open and close near each other |
| 7 | Morning Star | Upward Reversal | Three-bar bullish reversal pattern |
| 8 | Evening Star | Downward Reversal | Three-bar bearish reversal pattern |
| 9 | Three White Soldiers | Upward Continuation | Three consecutive green bars |
| 10 | Three Black Crows | Downward Continuation | Three consecutive red bars |
| 11 | Hammer | Bullish Reversal | Long lower wick |
| 12 | Shooting Star | Downward Reversal | Long upper wick |
Learning all these patterns will provide traders with a complete set of tools for market analysis. Each pattern has different strengths and limitations. Practicing in real market conditions will lead to a deeper understanding.
Examples of Pattern Usage in Real Markets
In a real market, traders must consider the market context before making decisions. For example, if a Pin Bar occurs at a key support level while the main trend is upward, this signal will be highly reliable. Waiting for the candlestick to close before entering a trade will help reduce false signals. Setting a Stop Loss behind the wick of the Pin Bar will help manage risk well. Pie action requires consistent practice to master.
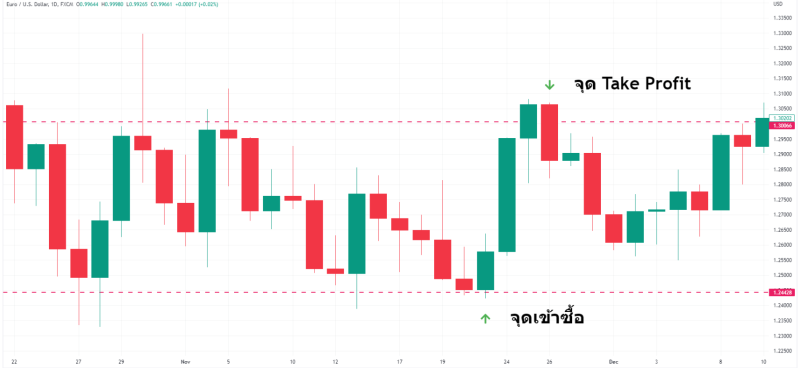
Example 1: The EUR/USD pair is in an uptrend. The price retraces to a support level and forms a Bullish Engulfing pattern. The trader opens a buy position when the price breaks through the high of the pattern. The Stop Loss is placed below the low, and the Take Profit is set at the next resistance level.
Example 2: The GBP/JPY pair is in a downtrend. The price bounces up to a resistance level and forms a Bearish Pin Bar. The trader opens a sell position when the price falls below the low of the Pin Bar. The Stop Loss is placed above the wick of the candlestick.
How to Trade with Price Action: A Step-by-Step Guide
Trading using price behavior analysis requires clear steps. Traders should have a comprehensive trading plan covering everything from analysis to risk management. Strictly following these steps increases the consistency of trading results. Discipline is a key factor that separates successful traders from unsuccessful ones.
Setting Entry and Exit Points with Price Action
A good entry point requires waiting for the pattern to be complete and confirmed. Popular entry points are when the price breaks through the high or low of the pattern. Exit points can be determined from the next support and resistance level or using the risk-to-profit ratio. Using this analytical method provides traders with clear reference points. Waiting for confirmation signals helps filter out false signals.
There are several ways to set entry points. The first is to enter immediately when the pattern is complete. The second is to wait for a retracement before entering. The third is to wait for the price to break through a key point of the pattern. Each method has different advantages and disadvantages. Traders should test and choose methods that suit their style.
Placing Stop Loss/Take Profit and Risk Management
The Stop Loss should be placed in a position where, if the price reaches it, it indicates that the analysis was wrong. For a Pin Bar, the Stop Loss should be placed behind the wick of the candlestick. The Take Profit should have a ratio of at least 1:2 to the risk. Position sizing should not exceed 1-2% of capital per trade.
| Elements | Recommendation | Rationale |
| Stop Loss | Place after a key point of the pattern | Prevent excessive losses |
| Take Profit | A ratio of at least 1:2 | Make the system profitable in the long term |
| State Size | Do not exceed 1-2% of capital | Preserve capital |
| Number of Positions | Do not open more than 3-5 positions simultaneously | Diversify Your Risk |
Good risk management means being able to survive in the market even after several consecutive losses. Professional traders prioritize capital preservation over profit.
Confirming Signals with Multiple Timeframes
Analysis across multiple timeframes increases the accuracy of signals. Start with a larger timeframe to see the main market trend, then move to smaller timeframes to find precise entry points. For example, use a daily chart to see the trend and a 4-hour chart to find entry points. Consistent signals across multiple timeframes are more reliable.
The principle is to trade in the direction of the larger timeframe. If the daily chart is trending upwards, look for buying opportunities in smaller timeframes. Trading against a larger timeframe carries higher risk. Successful traders typically use 2-3 timeframes for analysis.
Mistakes to Avoid in Price Action Trading
Many traders repeatedly make the same mistakes when using price behavior analysis methods. Recognizing these mistakes will help avoid them and improve trading. Most mistakes stem from a lack of discipline and patience, not a lack of knowledge.
Misinterpreting Patterns / Ignoring Market Context
The most common mistake is interpreting patterns without considering the context. The same pattern can have different meanings depending on where it occurs. Pin bars occurring in the middle of a trend are less reliable than those occurring at support and resistance levels. Trading every pattern seen without filtering will lead to losses. Price action always requires considering the overall market picture.
Other mistakes include entering trades before patterns are complete, looking for patterns where they aren’t, and ignoring major trends. Traders should practice reading charts objectively and avoid bias.
Trading Without a Risk Management System
The lack of a risk management system is a major cause of failure. Many traders open positions too large or don’t set stop losses. One large loss can wipe out an account. Having clear risk management rules and strictly adhering to them is essential.
Related mistakes include moving the stop loss further away when the price is close, increasing the size of a position when losing, and not cutting losses. These behaviors are driven by emotions and hinder success.
Resources and Tools for Price Action
Developing analytical skills requires continuous learning. There are many resources and tools that can help traders improve their abilities. Investing time in education will pay off in the long run.
Books, Courses, and Chart Examples
Recommended books for beginners include Japanese Candlestick Charting Techniques by Steve Nison and Trading Price Action by Al Brooks. Online courses are available on many platforms, both free and paid. Studying historical chart examples helps train pattern recognition. Keeping a trading journal helps track your progress.
Good online learning resources include BabyPips, Investopedia, and TradingView Ideas. These websites offer articles and videos that explain concepts in detail. Joining a trading community allows you to exchange knowledge and experience.
Tools for Reading Price Action (e.g., TradingView)
TradingView is the most popular platform for chart analysis. Users have free access to charts of assets worldwide. Drawing and marking tools aid in analysis. The Replay feature allows for practice with historical data. A community of users shares helpful ideas and analyses.
| Tools | Advantages | Price |
| TradingView | Complete charts, easy to use, large community | Free/Premium $12.95-$49.95/month |
| MT4/MT5 | Industry standard, EA support | Free |
| cTrader | Beautiful charts, fast response | Free |
| NinjaTrader | Advanced analytical tools | Free/Lease $99/month |
FAQ About Price Action Trading
What is Price Action / What is PA Forex
Price action analysis is a trading method that relies on reading price movements directly from candlestick charts. Traders do not use technical indicators but rely on interpreting market patterns and structures. This method is applicable to all financial markets, including the foreign exchange market. The basic principle is that price already reflects all the market information.
What are Price Action Patterns and How Many Types Are There (12 Types)?
Price action analysis patterns are statistically significant arrangements of candlestick charts. There are 12 important basic patterns: Pin Bar, Bullish Engulfing, Bearish Engulfing, Inside Bar, Outside Bar, Doji, Morning Star, Evening Star, Three White Soldiers, Three Black Crows, Hammer, and Shooting Star. Each pattern provides a different signal and has its own specific use.
What are the Important Candlestick Patterns in Price Action?
The most important patterns for beginners are the Pin Bar and Engulfing. The Pin Bar indicates price rejection and often occurs at reversal points. The Engulfing indicates a shift in the balance between buying and selling pressure. The Inside Bar is used for trading when the price breaks through a range. Thoroughly mastering these fundamental patterns will provide a strong foundation for further development. Traders should practice until they can quickly and accurately recognize the patterns.
You may also be interested in these additional publications: