Reading a candlestick chart is one of the fundamental skills every trader needs, whether you trade Forex, crypto, or stocks. Understanding candlestick chart patterns helps you see market behavior more clearly.
We are the Th-Option team and have prepared clear guidance on candlestick chart patterns — helping you understand how to read bullish market signals, bearish signals, and how to apply candlestick charts in real analysis.
What Are Candlestick Wicks?
Reading a candlestick chart is not just about looking at prices — it is about understanding the behavior of buyers and sellers in the market. When price moves, the chart creates various patterns that traders can use to predict the future direction of the market.
This article explains the key fundamentals of candlesticks — from the structure of a candle and popular patterns to how to apply them in technical analysis of real markets.
Why Do We Read Candlestick Charts?
Reading candlesticks helps us understand market behavior more clearly. Each candle displays the closing price, high, and low of that time period, making it possible to see which side — buyers or sellers — has the upper hand. Observing candlestick patterns helps us predict potential price direction and plan trades more effectively.
Additionally, understanding the closing price, high, and low also helps us determine whether the market is in an uptrend, downtrend, or price consolidation. Analyzing candlestick charts alongside trends and trading volume allows for more accurate trading decisions and reduces risk from market volatility.
What Is a Candlestick and How Does a Candlestick Chart Work?
This format is a method of displaying market price data over a given time period, with each candle reflecting key information about price movement — such as the closing price, high, and low.
Candlestick charts have become very popular in the forex and stock markets because market behavior is easier to observe than with traditional line charts.
The structure of a candlestick consists of two main parts:
| Candlestick Part | Meaning |
| Body | The middle section of the candle showing the open and close prices |
| Wick (Shadow) | The upper and lower lines showing the highest and lowest prices |
If the closing price is higher than the opening price, it is called a bullish candle. If the closing price is lower, it is called a bearish candle.
This basic pattern allows traders to read buying and selling pressure in the market on any given day.
Candlestick Structure and the Meaning of Wicks
Each candlestick provides more information than is apparent at first glance. The length of the body and wicks indicates the strength of the market during that time period.
A candle with a long body shows that one side clearly controls the market. A long bullish candle body means buying pressure is very strong.
Conversely, if the wick is very long, it means the market tested a price level but ultimately closed back near the starting point.
For example:
- A long upper wick may indicate selling pressure pushing the price down
- A long lower wick indicates that buying pressure has returned
- A four-price doji is a bar with virtually no body at all
These patterns form an essential foundation of technical analysis.
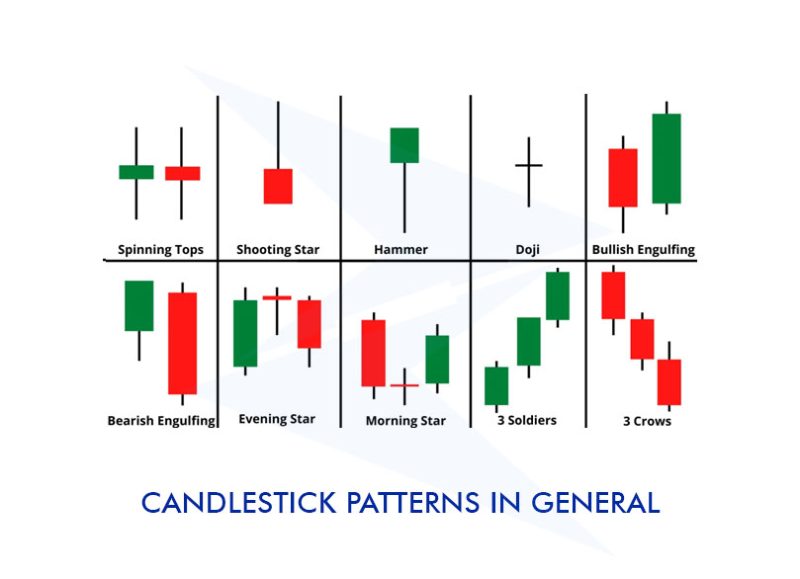
Bullish Patterns That Signal a Reversal

A bullish pattern signals that the market may reverse from a downtrend into an uptrend.
Examples of popular patterns include:
- Hammer: The hammer candlestick pattern is characterized by a small body and a long lower wick. It often appears after a downtrend, indicating that buying pressure has returned and an upward reversal is possible.
- Inverted Hammer: The inverted hammer candlestick pattern has a small body and a long upper wick. It often appears after a downtrend, suggesting that selling pressure is weakening and the price may reverse upward.
- Morning Star: The morning star is a three-candle pattern consisting of a bearish candle, a short candle, and a following bullish candle. It typically forms after a downtrend, pointing to a bullish reversal stronger than the Hammer.
- Bullish Engulfing: The bullish engulfing pattern occurs when a bullish candle completely covers the preceding bearish candle, showing that buyers have taken control of the market — creating the opportunity for a continued uptrend.
The Hammer candlestick pattern is one investors use frequently. Its defining characteristic is a long lower wick and a small candle body, indicating that buying pressure has returned after a price decline.
The Morning Star candlestick pattern is a three-candle pattern that typically forms after a downtrend and signals a strong reversal.
Bullish engulfing, or the engulfing pattern, occurs when a bullish candle covers the preceding bearish candle.
Bearish Patterns That Warn of a Market Reversal
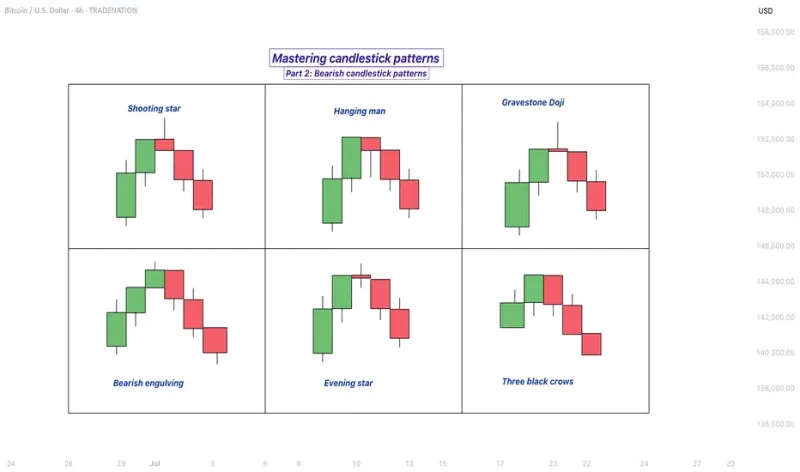
Bearish patterns indicate that the market may begin to decline after prices have risen.
Examples of commonly found patterns include:
| Pattern | Meaning |
| Shooting Star | Price rejection at a high level |
| Hanging Man | Signal of weakening uptrend |
| Evening Star | Three-candle reversal pattern |
| Three Black Crows | Sustained selling pressure |
The “Shooting Star” candlestick pattern has a long upper wick and a small body, and often appears at market peaks.
The “Evening Star” candlestick pattern is similar to the “Morning Star” but signals a reversal into a downtrend.
The “Three Black Crows” candlestick pattern is a three-candle formation indicating sustained selling pressure.
What Do Doji and Star Patterns Tell Us About the Market?
The Doji candlestick pattern is one where the opening and closing prices are very close together, leaving virtually no candle body.
This pattern often indicates market uncertainty and is a signal traders should approach with caution.
Examples of Star Patterns include:
- Doji Star
- Morning Star
- Evening Star
A Doji often forms when buying and selling pressure are balanced, which can sometimes lead to a market reversal.
Continuation Patterns for Spotting Trend Continuations
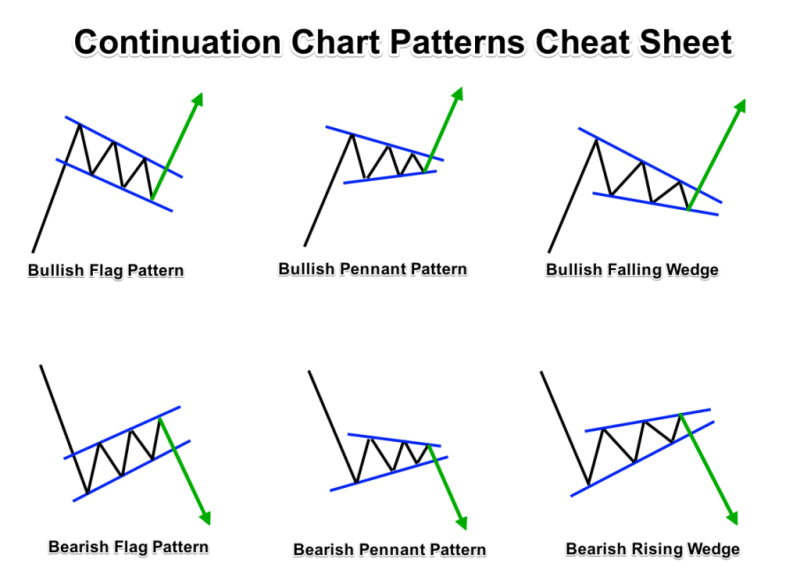
Not every pattern signals a reversal. Some patterns are continuation signals.
Notable examples include:
- Rising Three Methods (bullish continuation signal)
- Falling Three Methods (bearish continuation signal)
The Three Methods pattern indicates that the market is pausing before continuing in its current direction.
Continuation traders enter positions in the direction of the existing trend and try to capture the continuation move.
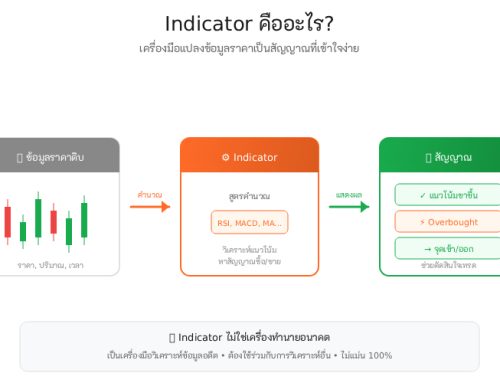
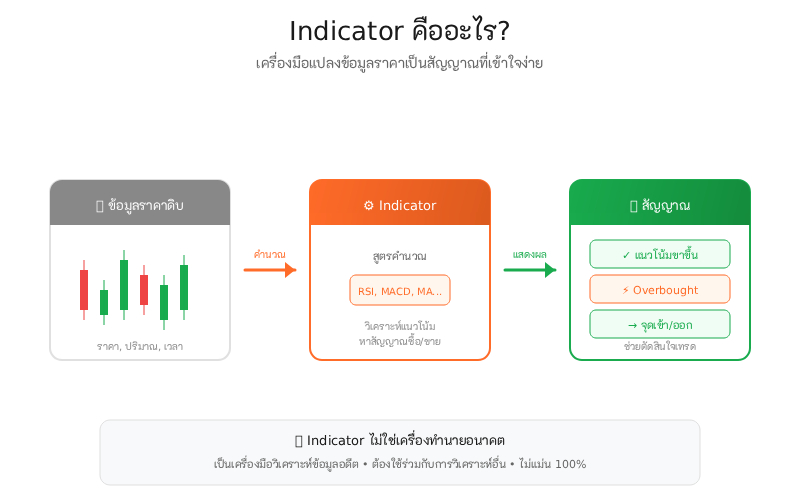
How to Use Candlestick Charts with Various Indicators
Candlestick chart patterns become more effective when used in combination with various indicators.
Popular indicators commonly used include:
- RSI (Relative Strength Index) – Helps identify whether the market is in an overbought or oversold zone to assess buying and selling pressure
- MACD (Moving Average Convergence Divergence) – Shows the trend and timing of price changes
- Stochastic – Used to observe the speed and direction of price, along with market entry and exit signals
For example, if a bullish pattern forms while the RSI is in the oversold zone, the signal is generally stronger.
Trading volume is another important variable. If a pattern forms alongside high trading volume, it typically means the market has strong backing.
Choosing the Right Time Frame for Analysis
The time frame has a significant impact on how you read candlestick charts.
Short-term traders often use 1-hour or daily charts.
In the forex and stock markets, using multiple time frames helps provide a broader overall picture of the market.
For example:
- The daily chart is used to identify the main trend
- The 1-hour chart is used to find entry points
Using multi-time frame analysis helps reduce losses and increase profit opportunities.
Are There Really 80 Candlestick Patterns, and Should You Learn All of Them?
Many sources mention as many as 80 candlestick patterns, but in reality most traders use only a handful.
The truly important patterns include:
- Doji
- Hammer
- Engulfing
- Harami
- Morning Star
- Evening Star
Learning too many candlestick patterns can lead to confusion.
Professional traders tend to focus on patterns that appear frequently and prioritize understanding price behavior over memorizing formations.
How to Practice Reading Candlestick Charts as a New Trader
Learning to read candlestick charts requires practice with real charts.
The easiest method is to view market charts every day and observe candlestick patterns.
Popular learning resources include:
- Books on technical analysis
- YouTube videos
- Reviewing historical market charts
Another good approach is keeping a trading journal to track which patterns consistently deliver the best results.
Using Candlesticks in Forex and Stock Market Analysis
Candlestick charts are used across multiple market types — the forex market, crypto market, and stock market.
Investors commonly use candlestick patterns to identify entry and exit points in the market.
Practical usage examples:
| Scenario | Interpretation |
| Hammer after a downtrend | Possible bullish reversal |
| Shooting Star after an uptrend | Possible bearish reversal |
| Engulfing near support | Buy entry signal |
Analysis should consider multiple factors such as trend, volume, and indicators.
Key Things to Remember About Candlestick Charts
- Candlestick charts are a fundamental tool of technical analysis
- Various patterns help identify bullish and bearish signals
- Doji, Hammer, and Engulfing are among the most frequently used patterns
- They should be used alongside indicators such as MACD, RSI, and Stochastic
- Time frame affects the accuracy of signals
- Practicing with real charts improves your understanding of price behavior
- There is no need to memorize all 80 candlestick patterns
When candlestick charts are properly understood, traders can see market opportunities more clearly and use that information to plan future trades with greater reasoning.
Reading Candlestick Charts FAQs
How do you read a candlestick chart?
Look at the closing, opening, high, and low price of each candle. The color and size of the candle indicate direction and buying/selling pressure.
How do you read a gold candlestick chart?
The same as any other chart — observe the candle body and wicks to find bullish or bearish signals.
How can you tell if a stock will go up or down?
Use candlestick patterns in combination with trading volume and indicators such as RSI and MACD. Bullish signal + high trading volume = uptrend; bearish signal = downtrend.
What do candlestick charts look like?
- The body shows the open-close price range
- The shadow shows the high-low price range
- The color indicates price direction
What does a candlestick chart consist of?
It consists of multiple candles arranged in chronological order, displaying buying/selling pressure and price patterns.
Do groups of multiple candles have a lot or a little price overlap?
High overlap = market is consolidating, low volatility.
Low overlap = clear trend, market moving in one direction.
Should you try reducing the time frame for a better perspective?
Switching to a shorter time frame helps you see short-term price volatility more clearly and identify entry and exit points with greater precision.
Read also about:


Leave A Comment