Trading success requires ongoing learning and adaptation. No one approach fits all, so understanding the nuances of different strategies is crucial to developing a comprehensive plan. This guide to trading strategies by Th-Option aims to explore the main strategies in detail, giving you the knowledge and tools to create a versatile and effective toolbox tailored to your unique needs.
Best trading strategies to effective trading
Every style dangles in the balance one or the other advantage over another, from scalping and day trading which aim at reactions of the price change to positional and momentum trading. The characteristic of the day trading includes making quick calls and judgment calls, making patience the prime virtue in positional traders. An inquisitory analysis along with postulating the technical and fundamental analysis would empower the traders to make unbiased decisions.
Modern markets are too dynamic, demanding every trader adapt their strategies and change priorities according to the market mood or overnight events. Being responsive is the first step in smart investing; therefore, always being versant and knowing the strengths and weaknesses of each style will help you face the huge challenge before you on keeping the strategy in check and prospering.
Popular trading strategies
Trading strategies confer the foremost importance and enable the successful trader’s each and every move. They specify market entry and exit points along with the duration for which the market is held. Due to the different ways financial markets operate trending, ranging, or highly volatile no universal strategy can be applied under all conditions. Who can resist the allure of the market and the challenge of devising winning strategies? That’s why traders tend to adopt quite various approaches according to their traits, time, risk appetite, and monetary aspirations.
| Strategy | Typical Holding Time | Main Analysis Type | Risk Level | Time Commitment | Best For |
| Scalping | Seconds to minutes | price action, volume, order flow | Very high | Full-time, intense | Very fast, disciplined traders |
| Day Trading | Minutes to hours (same day) | Technical indicators, chart patterns | High | Full-time | Active traders who like fast markets |
| Momentum Trading | Hours to weeks | TRSI, MACD, volume | Medium to high | Active but flexible | Traders who follow strong trends |
| Swing Trading | Days to weeks | Technical + fundamental | Medium | Part-time friendly | Traders who want balance |
| Position Trading | Weeks to years | Fundamental + macro trends | Low to medium | Low | Long-term, patient traders |
Day trading: quick in and out

Day trading is a trading technique that is practiced over a short term and in which positions are completely opened and closed within the same trading day. Traders do not keep trades overnight, which allows them to dodge sudden price changes caused by news or other market happenings.
If you wonder what day trading is, it is nothing but exploiting intraday price fluctuations. With that, traders aim to gain from minute price alterations through the execution of numerous trades during the day.
How day trading works
Technical analysis, price charts and indicators are the main sources of information for day traders. Besides, they watch the markets very closely and make rapid moves as soon as trading chances come up.
Some of the most common tools for day trading are:
- Candlestick charts
- Moving averages
- Support and resistance levels
- RSI (Relative Strength Index)
- MACD
Day trading usually means big trading volume at times and might also include some leverage. Leverage can increase either profit or loss by sizable bounds.
Advantages of day trading
- No overnight risk
- Fast feedback on trading performance
- Many daily opportunities
- Can generate steady income
Risks of day trading
- Requires full-time attention
- High stress
- Transaction fees can add up
- Losses can accumulate quickly without discipline
An investor observes the price of a certain stock oscillating from $50 to $51 in the morning session. The investor places a buy order at $50.20 and a sell order at $50.80 multiple times throughout the day, thereby making small profits from each price fluctuation.
Swing trading: capturing medium-term trends
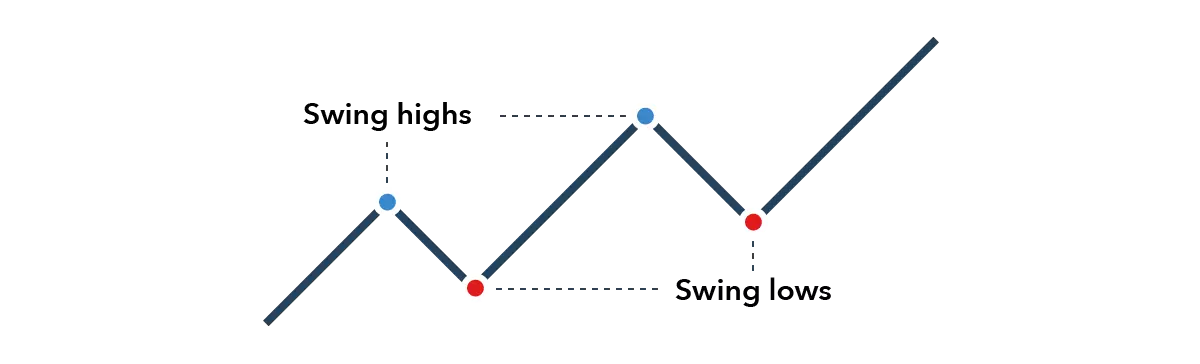
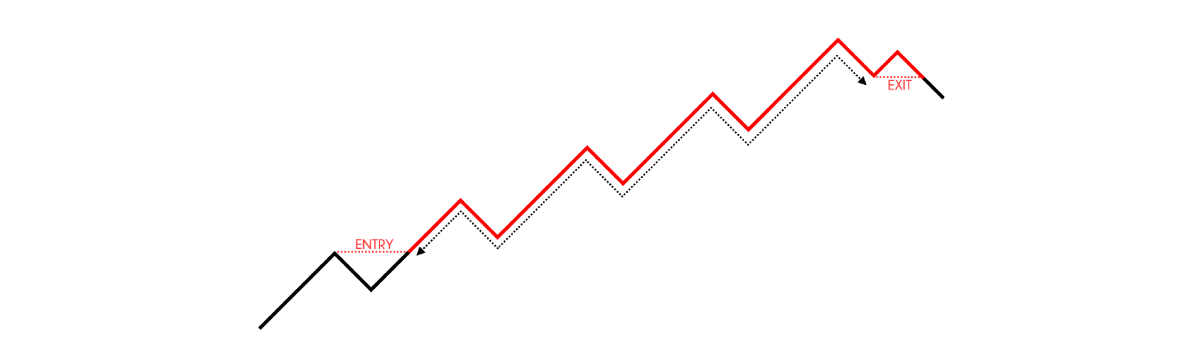
Swing trading is the technique that mainly concentrates on holding positions actively for a few days or sometimes even weeks. Swing traders do not intend to make their profits from tiny intraday fluctuations but rather to catch big price changes, which are referred to as “swings.”
This strategy is suitable for those traders who might not be able to monitor the markets constantly throughout the day, yet still, would like to participate in trading activities.
How swing trading works
Swing traders combine:
- Technical analysis to find entry and exit points
- Fundamental analysis to understand the broader market direction
They usually enter trades when a trend starts and exit when momentum slows.
Key features of swing trading
- Trades last from a few days to a few weeks
- Fewer trades than day trading
- Less screen time required
- Higher profit per trade
A stock exceeds a resistance level and a bullish trend follows. A swing trader purchases the stock and retains it for two weeks until a substantial resistance level is reached, thereby selling at a profit.
Scalping: profiting from small price movements
Scalping is among the quickest trading methods. The scalpers’ target is to realize gains from minute changes in price by executing numerous trades in a single day.
They do not stay idle for significant price movements but rather utilize market noise and minor fluctuations.
How scalping works
Scalpers:
- Use very short timeframes (1–5 minute charts)
- Open and close trades within seconds or minutes
- Use tight stop losses
- Rely on fast execution and high liquidity
This method requires strong focus and quick reactions.
Pros of scalping
- Many trading opportunities
- Small market movements are enough to make profits
- Lower exposure to major market swings
Cons of scalping
- Extremely demanding
- Requires advanced trading platform
- High transaction costs
- Can be mentally exhausting
Example: A currency pair moves between 1.1050 and 1.1055 repeatedly. A scalper buys at 1.1050 and sells at 1.1054 multiple times, collecting small profits on each trade.
Position trading: long-term market plays
Position trading is a long-term trading plan in which traders keep their positions for weeks, months, or even years to receive the profit from big, sustained market trends. In contrast to short-term styles concentrating on daily price fluctuations, position traders intend to seize the “big picture” movements caused by economic cycles, interest rates, and major financial events.
This method suits those traders who do not wish to monitor charts all day and prefer to make a smaller number of well-researched trades with the potential for higher rewards.
How position trading works
Position traders predominantly rely on fundamental analysis and macroeconomic trends to make their decisions rather than on short-term chart patterns. They look at the factors that impact asset prices in the long run, for instance:
- Interest rate policies
- Inflation and economic growth
- Corporate earnings and financial statements
- Industry trends
- Government policies and global events
Technical analysis is still being applied, however, its use is primarily focused on the determination of optimal entry and exit points rather than on the making of trading decisions on a frequent basis.
A trader thinks that the stocks of renewable energy companies would rise in the next few years because of the government support and the increase in demand. The trader goes through the financial statements of the companies and the market trends, then he buys stocks of one renewable energy company and keeps them for two years, selling only when the long-term trend dries up.
| Feature | Position Trading | Day Trading | Swing Trading |
| Timeframe | Weeks to years | Minutes to hours | Days to weeks |
| Trade frequency | Low | Very high | Medium |
| Main analysis | Fundamental | Technical | Mixed |
| Stress level | Low | High | Medium |
| Screen time | Minimal | Constant | Moderate |
Momentum trading: following market strength
Momentum trading is predicated on the hypothesis that once an asset has exhibited a strong movement in one direction, it will frequently continue to do so for a certain period. Rather than forecasting a reversal of the market, momentum traders slide along the existing trends and make their entries when the price movement is strong.
This technique is effective in the markets with unmistakable trends, whether it be a rise or decline.
How momentum trading works
Momentum traders look for assets that show:
- Strong price movement
- High trading volume
- Clear trend direction
They use technical indicators to confirm momentum and avoid false signals.
Common momentum indicators include:
- RSI (Relative Strength Index)
- MACD (Moving Average Convergence Divergence)
- Moving Averages
- Volume indicators
These tools help traders determine whether a trend is gaining or losing strength.
Key rules
- Enter trades in the direction of the trend
- Avoid sideways or weak markets
- Use stop losses to protect capital
- Exit when momentum slows or reverses
Momentum trading is not an approach that involves purchasing at the lowest point and selling at the highest point. On the contrary, it is a strategy whereby one purchases the strength and then sells when that strength disappears.
Case in point: A stock with high volume breaks through a resistance level. The Relative Strength Index goes up to 60, and Moving Average Convergence Divergence presents a bullish crossover. A momentum trader takes a position in the stock and profits from the increase in price until RSI begins to decrease and the price goes down through an important moving average line.
| Feature | Position Trading | Momentum Trading |
| Trade duration | Weeks to years | Hours to weeks |
| Main focus | Fundamentals & trends | Price strength |
| Trading frequency | Low | Medium to high |
| Best market type | Long-term trends | Strong trending markets |
| Risk style | Slow, steady | Fast, reactive |
Technical analysis strategies
Technical analysis is the method of studying price patterns of the past to predict future movements of the market. Market participants’ behavior is inferred and the prices’ reaction to different scenarios are devised through the usage of price charts, volume data, and technical indicators. These techniques help to discover trends, reversals, and significant price points where the buying or selling pressure is heavy.
In contrast to fundamental analysis, which is concerned with the economic data, technical analysis is all about the price. This indeed makes it very reliable in the fast-paced forex trading market where the prices are constantly changing and the traders need quick signals for entering and exiting positions.
Using moving averages for trade signals
Moving averages are applied on the price data in a way that their smoothing reveals the trend direction. They get rid of the market noise and thus, it becomes very clear that prices are mostly going up, down, or horizontal.
The two most common types are:
- Simple Moving Average (SMA) – calculates the average price over a fixed number of periods
- Exponential Moving Average (EMA) – gives more weight to recent prices, making it more responsive
Crossing short-term moving average over long-term ones is generally considered a potential buy signal. Conversely, when they cross under, a sell may be indicated.
The moving averages have become the mainstay of trend trading. Trend traders use them to remain in the market as long as the trend is strong. A rising moving average implies that the price is above the market and thus bullish, while a falling moving average indicates a bearish trend as the price is below the market.
How technical analysis supports forex traders
In the foreign exchange market, the principale factors that cause price fluctuations are news, interest rates and economic events worldwide. Technical analysis assists traders in determining the market’s reaction to such news.
Traders on the forex market mostly depend on:
- Moving averages
- RSI (Relative Strength Index)
- MACD
- Support and resistance levels
These tools are considered some of the best forex trading strategies because they work across all currency pairs and timeframes.
Technical indicators in binary options
An effective binary options trading strategy requires perfect timing. Technical indicators generate short-term signals that assist in forecasting the price movement direction (up or down) within a specified period.
For binary options, the following indicators are commonly used:
- Moving averages
- Bollinger Bands
- Stochastic Oscillator
- RSI
Traders quickly located entry points in the markets active with the help of those tools.
Signals are needed for high trading activity that can be trusted. Technical analysis gives feedback from the market in real-time thus it is the best option for the most active traders who open and close positions frequently.
Wherever you trade daily, weekly, or monthly, technical analysis will help your decisions not to be affected by emotion but to be based on data.
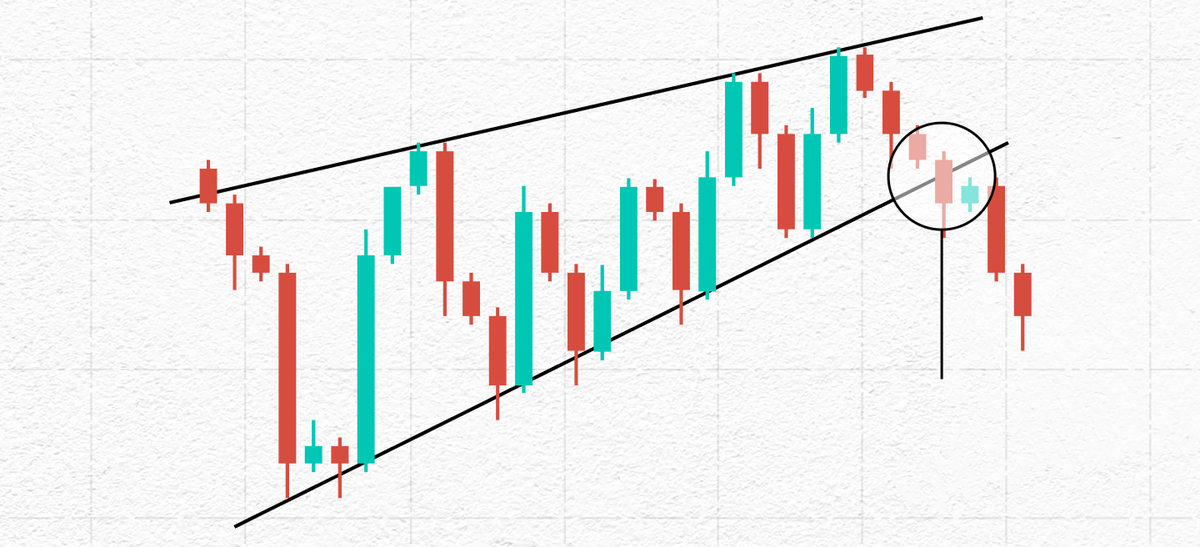
Recognizing chart patterns
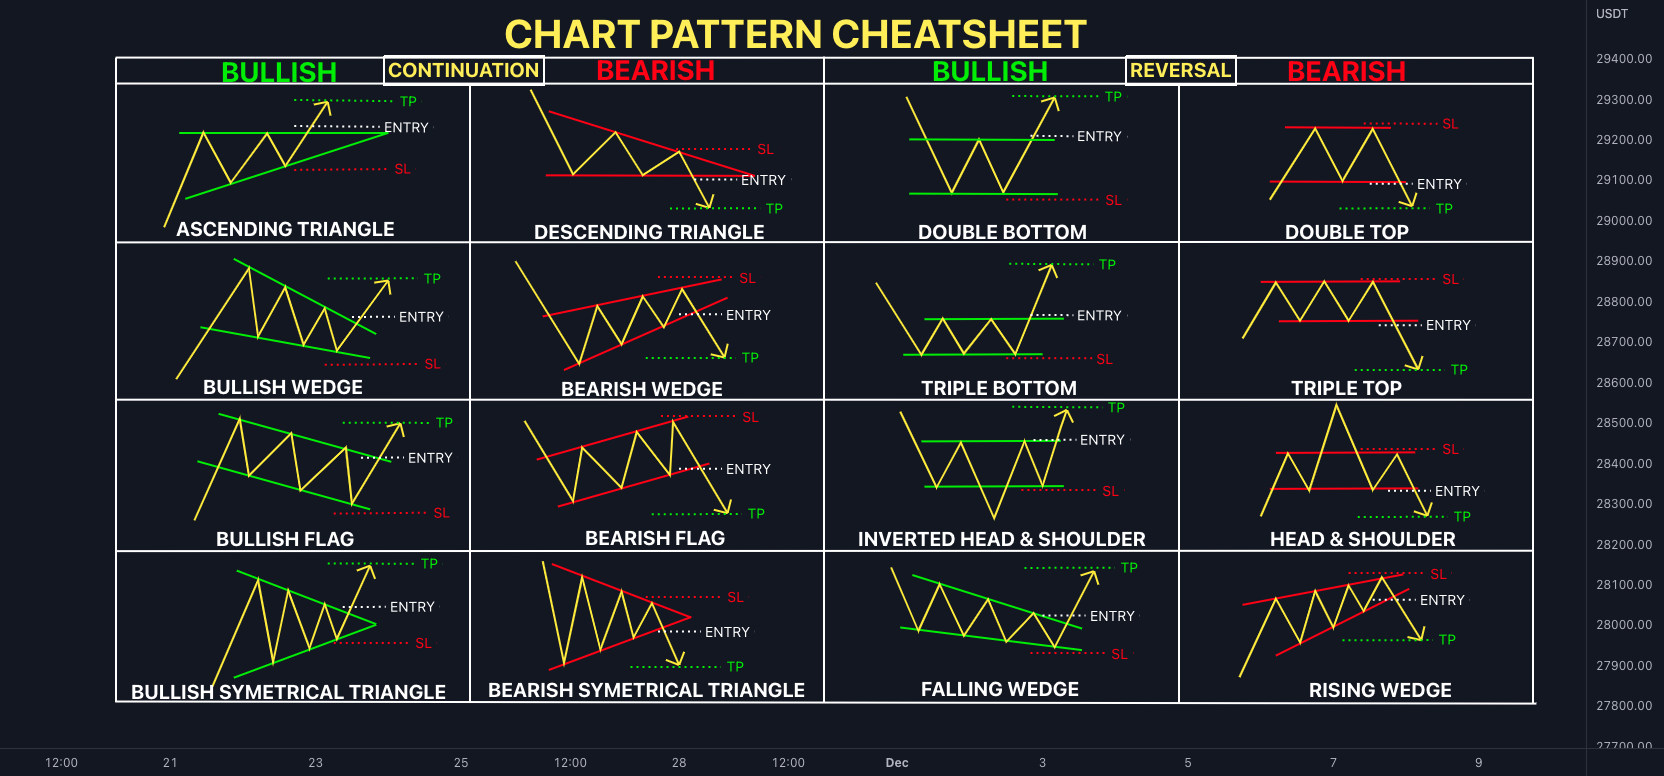
Head and shoulders, double tops and bottoms, and triangles along with other chart patterns suggest visually the likelihood of price reversal or continuation of the trend. These figures give away the market’s mood and generals the traders in terms of when the buyers or the sellers are becoming more powerful.
Patterns recognition can be a very effective support in trading because it can give the traders the signals to spot the breakout that will lead to the new trend or identify the area of price consolidation (the trading range where the price is getting ready to break out).
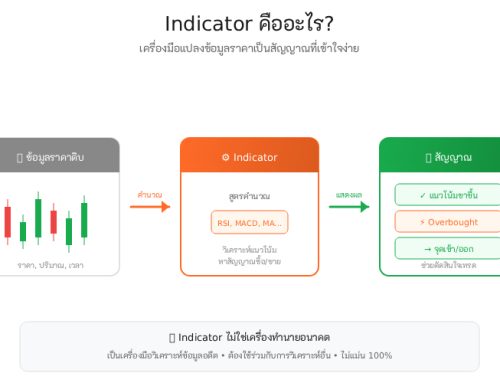
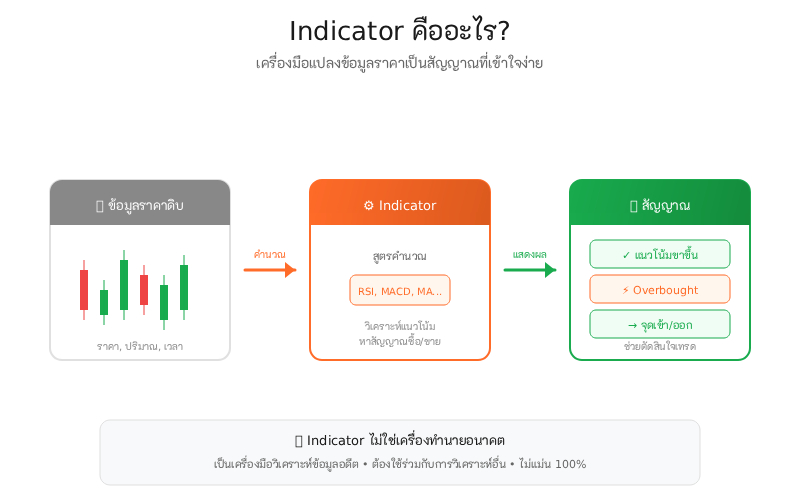
Popular technical indicators: RSI, MACD, Bollinger Bands
The Relative Strength Index (RSI) indicates an asset’s overbought or oversold condition, while MACD measures the change in momentum, and Bollinger Bands indicate market volatility. When these indicators are combined, they support the confirmation of the strength of a price move or its reversal.
For instance, if RSI indicates overbought along with price hitting the upper Bollinger Band, plus MACD turning down, this may be a good moment to close or at least not trade. This integration is most often seen in the best trading strategy as it lowers false signals and enhances timing.
Fundamental analysis strategies
Fundamental analysis pertains to the evaluation of the factors to which such things as politics and the economy give rise and prices of the assets. Those elements include, among others, interest rates, inflation, corporate profits, and regulations. Instead of focusing on short-term price movements, it tries to find out the asset’s true worth.
This method is especially familliar to traders keeping positions for a longer time. They can detect which assets are undervalued or overvalued and join their trading style with the long-term market trends. A good number of long-term investors regard it as one of the best trading strategies for secure and profitable trading.
Economic data impact on markets
Economic indicators like the growth of GDP, unemployment rates, and inflation metrics have a profound impact on the financial markets. Strong data usually lifts prices, whereas weak data might lead to a fall of the markets or an establishment of a trading range due to the uncertainty of the investors.
Traders take these releases as a cue to make decisions regarding the opening up, modification, or closing of their trading positions.
Algorithmic and automated trading strategies
Algorithmic systems are computer programs which automatically perform operations according to a predefined set of rules, thus executing the strategies. It is an approach that not only speeds up trading but also makes it less affected by emotions. Besides, it is possible for users to backtest strategies with historical data before actually trading them. Besides, these automated systems can keep track of many markets at the same time, which means more efficient and widespread trading.
Basics of algorithmic trading
Algorithmic systems rely on software that is deployed following specific rules to automatically place buy and sell orders. They make it possible to carry out high-frequency trades and process a lot of data quickly, thus allowing the users to take advantage of the very small inefficiencies in the market. Additionally, these systems lessen the impact of accidental wrong moves made by traders and also keep the emotional factors that could influence their decisions to the minimum, overall improving the consistency of the market being participated in.
How to choose the best strategy for your trading style
Your choice of a market approach will be based on your level of experience, how much time you can dedicate to it, and your risk tolerance. The inexperienced usually to start with simple techniques such as swing trading strategies or position approaches, while the more experienced may choose scalping forex or scalping strategy. Continuous testing and learning are necessary to discover the strategy that is the most suitable for you.
FAQs
What are the best Forex trading strategies for beginners?
Swing trading and position investing are frequently recommended for novice traders since they are associated with lesser strain and more straightforward implementation than rapid trading methods.
Can I combine multiple trading strategies?
Indeed, the combination of strategies can lead to the spreading out of risks and make the most of diverse market conditions, however, it will need vigilant management to steer clear of clashing signals.
How long does it take to master a trading strategy?
Mastery is subject to the dedication of the individual, the available learning resources, and market experience; it is usually the case that one takes several months to years before achieving consistent profitability.
What is mean reversion trading strategy?
An approach that is based on the premise that the price will return to the mean. Traders buy when it is very cheap and sell when it is very high.
What is SMC trading strategy?
SMC, a firm focusing on the tracking of large institutional trades through the review of market structure, liquidity, and order blocks.
What is the best day trading strategy?
There is no definite answer to this, but it is known that trend-following and breakout strategies seem to be working better.
What is a Forex trading strategy?
These are the guidelines that are applied to make a decision regarding the purchasing or selling currency pairs as per the analysis of either technical or fundamental factors.
Read also about:


Leave A Comment