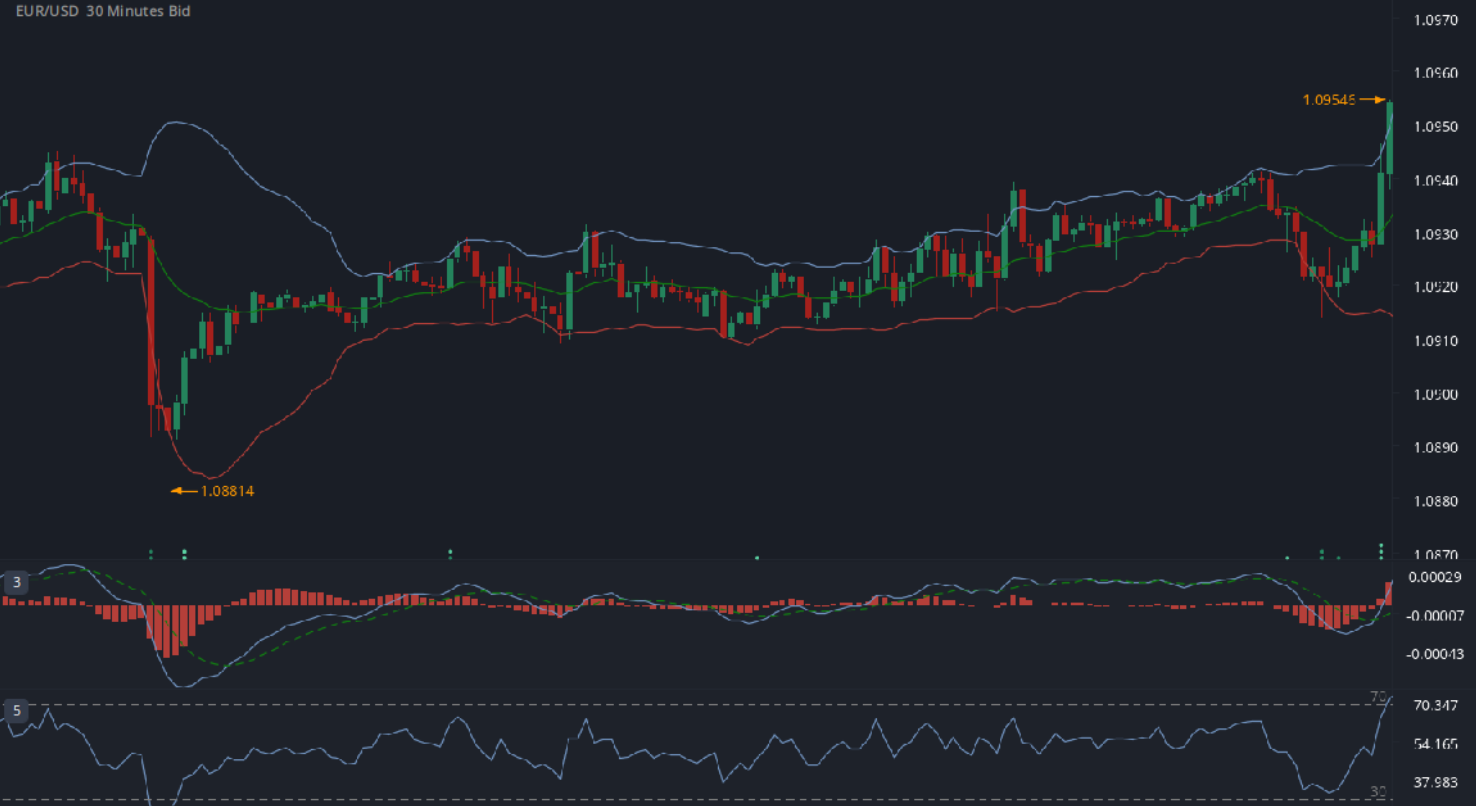
Price charts are widely used in stocks, forex, and Binary Options for their clear visual representation of price movements. Mastering the candlesticks helps traders anticipate market shifts and make informed decisions. These patterns condense complex data by showing opening, closing, high, and low prices in one candle stick, offering quick insights into market sentiment. This is vital in fast markets, especially when trading binary options, to spot trends and reversals with precision.
I’m Amina Rahman, with 9+ years of experience in trading forex and Binary Options. My team and I have studied candlestick chart pattern analysis extensively and want to share practical tips to build your confidence. With the right guidance and enough practice, mastering the chart candlestick becomes a powerful asset in your binary options trading strategy.
This guide covers the basics of these patterns, how to spot formations, combining them with indicators, common pitfalls, and helpful tools to boost your technical skills in binary options trading.
Components of a Candlestick: Body, Wick, and Shadows
A candlestick consists of three main parts: the body, wick (or shadow), and sometimes upper and lower shadows. The body shows the range between the open and close prices of a session. If the closing price is higher than the opening, the body is usually green or white, indicating bullish sentiment. A red or black body suggests bearish pressure. The wicks or shadows represent the highest and lowest prices, which is crucial in binary options strategy where volatility matters. Even bitcoin candlestick chart formations reflect similar behavior, making this concept universal across asset classes.
Types of Candlestick Patterns
Candlestick chart pattern are crucial tools for technical analysis, providing traders with visual representations of price movements over time. These patterns are generally divided into two main categories: single candlestick patterns and multiple candlestick patterns.

Single Candlestick Patterns
Single patterns like Doji, Hammer, and Shooting Star provide immediate market signals. A Doji signals indecision—a key signal in trading binary options. A Hammer suggests buyers regained control, which might lead to a bullish move. A Shooting Star after an uptrend indicates a potential bearish reversal. Recognizing these candlesticks in real time supports rapid decision-making in short-term strategies, especially useful in Binary Option scenarios.
Multiple Candlestick Patterns
More complex patterns such as Engulfing, Morning Star, and Evening Star involve combinations of candlesticks. For example, a Bullish Engulfing pattern, often seen in the bitcoin candlestick chart, signals strong buyer interest when it follows a downtrend. Morning Star and Evening Star formations are key indicators in determining reversals, highly relevant to any binary options trading strategy.
Bullish vs Bearish Candlesticks
Understanding bullish versus bearish candlesticks is fundamental. Bullish patterns suggest upward momentum, while bearish patterns indicate selling pressure. Differentiating these correctly allows traders to set appropriate entry and exit points, especially when applying a binary options strategy during volatile sessions.
How to Interpret Candlestick Patterns in Trading
To interpret candlestick chart pattern formations, traders must assess size, shape, and context. For example, a large bullish engulfing pattern following a downtrend indicates potential reversal. In binary options trading, such signals can determine whether to place a call or put option. Combining candlesticks with volume data adds another layer of confidence.
Using Candlestick Charts for Market Trend Analysis
A chart candlestick series can indicate trend direction. Consistent bullish candles suggest an uptrend; consistent bearish ones show a downtrend. Sideways patterns indicate consolidation. This trend recognition is essential in binary options trading, where timing is everything.

Combining Candlestick Patterns with Other Technical Indicators
While candlesticks provide strong visual cues, pairing them with technical indicators like RSI, MACD, or Moving Averages filters noise and confirms setups. For instance, combining a Bullish Engulfing candle with RSI divergence strengthens a trade signal. This approach is core to a reliable binary options trading strategy.
Common Mistakes When Reading Candlestick Charts
Errors include relying on one candle stick without context or ignoring other tools. Traders often overlook trend direction, support/resistance levels, or volume. For example, placing trades based on a single Doji without confirmation can lead to losses. A disciplined approach using chart candlestick interpretation alongside other tools reduces risk in Binary Option trading.
Tools and Software for Candlestick Chart Analysis
Platforms like MetaTrader, TradingView, and IQ Option offer tools for analyzing candlestick chart pattern formations. Many platforms also support binary options, letting you test strategies with live or demo accounts. Even bitcoin candlestick chart overlays are now standard on most platforms, aiding crypto traders.
Tips for Beginners to Master Candlestick Reading
Start small—learn a few patterns, then expand. Practice on demo accounts. Keep a journal to track outcomes. Use visual tools to mark winning and losing signals. These habits help beginners sharpen intuition and avoid traps common in trading binary options.
FAQ
Price patterns, while powerful, are most effective when combined with other technical analysis methods such as trend lines, volume analysis, or indicators like moving averages and RSI (Relative Strength Index). Relying solely on price patterns may lead to incomplete or misleading conclusions, as they don’t always account for broader market influences or sudden external events. Moreover, the effectiveness of these patterns can vary depending on the timeframe and market conditions. For instance, patterns observed on shorter timeframes may signal quicker reversals or trends, while those on longer timeframes tend to indicate more significant market movements. Therefore, traders should always consider the overall market context, including volatility, economic factors, and news events, when interpreting price patterns to ensure more accurate predictions..
How reliable are candlestick patterns in predicting market moves?
While no tool is perfect, candlestick chart pattern recognition combined with other technical analysis tools provides strong probabilistic insights
Can candlestick charts be used for all asset types?
Yes, they are widely used in stocks, forex, commodities, and Binary Options, and are equally effective in reading bitcoin candlestick chart data.
What timeframe is best for reading candlestick charts?
It depends on your style. Scalpers might use 1-minute charts, while long-term investors prefer daily or weekly chart candlestick views.
Read also about:


Leave A Comment