Indicator is a tool that traders and investors use to analyze price and market direction. Many people have seen colorful lines on charts but are unsure what they mean. Th-Option has compiled complete information to help you understand what an indicator is and how to use it effectively.
What is an Indicator? (Overview)
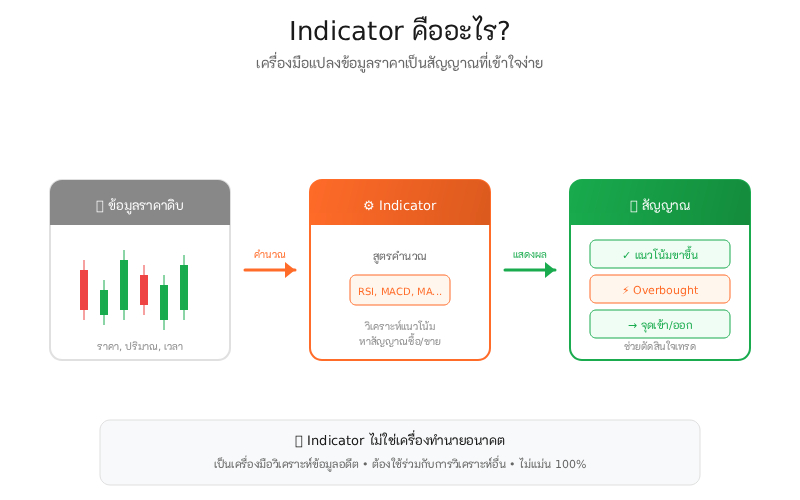
In simple terms, an indicator is a technical tool calculated from historical price data such as open, close, high, low prices, and trading volume, then displayed as lines, bars, or numbers on a chart. It helps traders see trends and signals that may not be visible from the price chart alone. Indicators transform raw data into more understandable signals, making trading decisions more methodical rather than guesswork.
Using indicators in analysis is important because it helps traders see the bigger picture of the market. Rapid price fluctuations can be confusing regarding market direction. Indicators filter out this volatility and highlight the underlying main trends. They also help identify potentially good entry and exit points, indicate overbought or oversold conditions, and confirm signals from other analyses, giving traders greater confidence in their decisions.
However, it’s important to understand that indicators do not predict the future. They are tools to analyze past and current data. Using them requires understanding and experience, not just buying or selling when lines cross. Successful traders usually incorporate indicators as part of a comprehensive analysis system rather than relying solely on them.
Types of Indicators
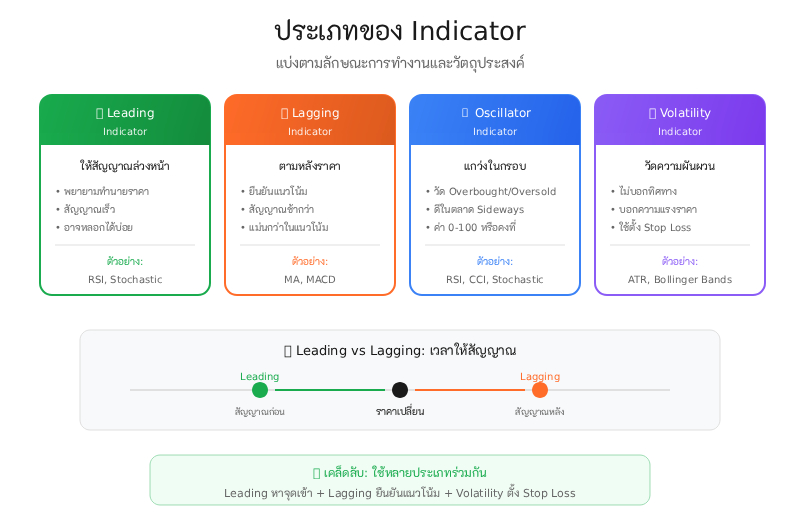
Indicators can be categorized by function and purpose. Understanding the types helps you choose the right indicator for your trading strategy. Each type has its strengths and limitations. Some are better for trending markets, others for sideways movements.
Leading Indicators attempt to predict price movements before they occur. They often provide signals faster than actual price changes, giving traders a chance to enter the market early. Common examples include RSI and Stochastic. Pros: fast signals. Cons: more false signals due to predicting what hasn’t happened yet.
Lagging Indicators follow price movements and give signals after a trend has started. They are typically used to confirm ongoing trends rather than predict. Common examples: Moving Average, MACD. Pros: more accurate once a trend is established. Cons: slower signals, may miss the trend’s start.
Oscillator Indicators fluctuate between set high and low values and indicate Overbought or Oversold conditions. They work well in sideways markets but can give false signals in strong trends. Common examples: RSI, Stochastic, CCI.
Universal Indicators can be used in various markets and situations, not limited to forex, stocks, or crypto. Some indicators are designed for trend identification, entry/exit points, or volatility measurement. Examples: Moving Average, Bollinger Bands.
Popular Indicators
Many indicators are available, but some are especially popular for their ease of use and reliability. Familiarity with these will give you foundational tools for market analysis. Each has a different purpose and usage.
RSI Indicator
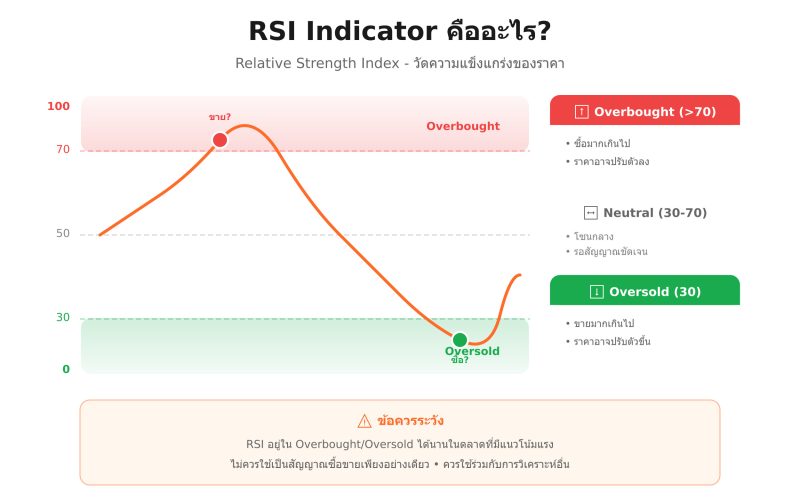
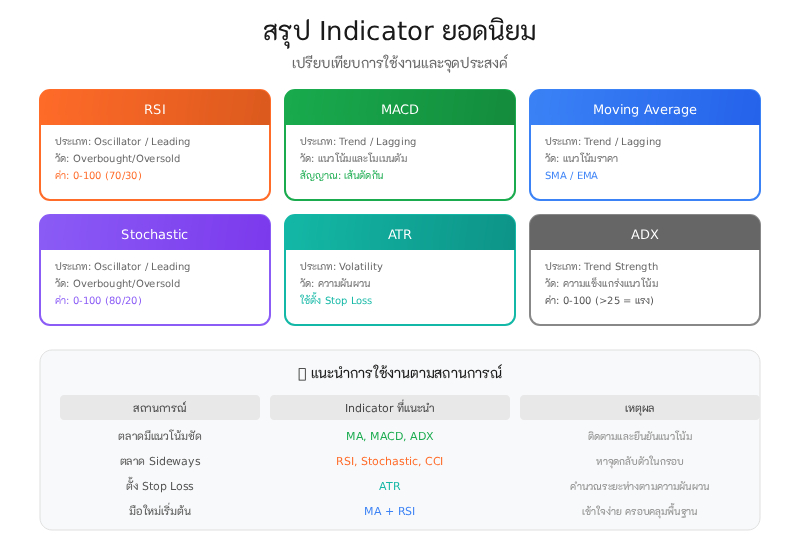
RSI (Relative Strength Index) is an oscillator measuring price movement strength by comparing upward and downward movements over a set period. RSI ranges from 0 to 100. Typically, values above 70 indicate Overbought, below 30 indicate Oversold. Developed by J. Welles Wilder Jr., RSI is among the most popular indicators globally.
RSI is commonly used to find potential price reversals. Overbought RSI may signal a price drop; Oversold RSI may signal a price rise. It also identifies Divergence, when price and RSI move in opposite directions, indicating a weakening current trend.
ADX Indicator
ADX (Average Directional Index) measures trend strength, not direction. Values range from 0 to 100. Above 25 indicates a strong trend; below 20 indicates no clear trend. ADX is often used with +DI and -DI, which show trend direction.
ADX helps filter other indicator signals. Strong trend (high ADX) favors trend-following strategies; weak trend (low ADX) favors range trading. Knowing market conditions aids in selecting the right strategy.
CCI Indicator
CCI (Commodity Channel Index) measures price deviation from the statistical mean. Despite its name, it applies to all markets. No fixed high/low limits, but generally above +100 is Overbought, below -100 is Oversold.
CCI helps spot potential reversals or trend beginnings. Crossing above 0 may signal buying; below 0 may signal selling. It can also identify Divergence like RSI.
ATR Indicator
ATR (Average True Range) measures price volatility, not direction. Useful for setting Stop Loss and position sizing based on average market movement.
High ATR = high volatility; Low ATR = calm market. Traders often multiply ATR to set Stop Loss distance from entry price.
STO Indicator (Stochastic)
Stochastic Oscillator compares closing price to the price range over a period. Values 0–100. Above 80 = Overbought; below 20 = Oversold. %K (fast) and %D (slow average of %K) lines form the indicator.
Common usage: %K crossing %D in Oversold zone = buy signal; in Overbought zone = sell signal. Works well in sideways markets but may give false signals in strong trends.
MACD and Moving Average
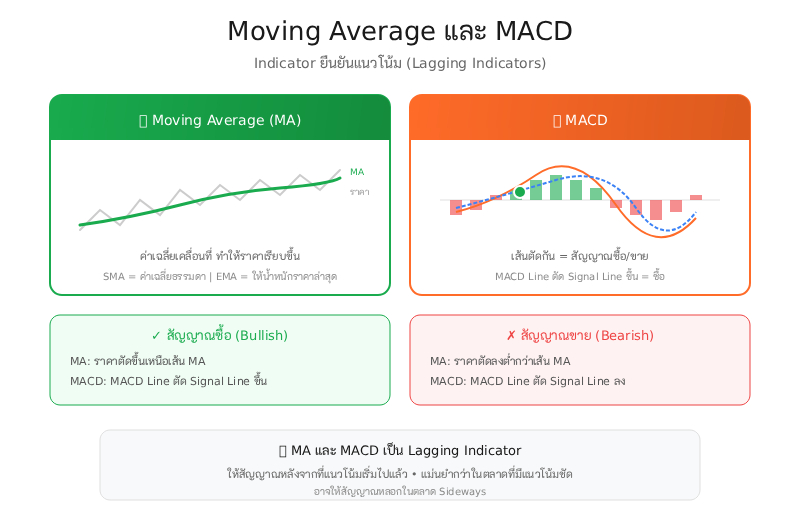
MACD (Moving Average Convergence Divergence) shows the relationship between two moving averages: MACD Line, Signal Line, and Histogram. Used to find trend direction and timing. Cross above Signal Line = buy; cross below = sell.
Moving Average smooths price and highlights trends. Types: SMA, EMA (more weight on recent prices, reacts faster).
Run Flat Indicator Inoperative
A car warning indicating the tire pressure monitoring system is inactive. Not related to trading. Often searched due to the word “Indicator” but unrelated. Run Flat Tires can run while flat, and this message warns the driver.
How to Use Indicators (Basic Guide)
Understanding theory is one thing; applying it is another. Effective use requires practice and experience. Don’t just buy/sell when lines cross; consider market context and other factors.
Reading Overbought/Oversold is common. RSI/Stochastic in Overbought (RSI>70) may signal potential drop; in Oversold (RSI<30) may signal rise. In strong trends, prices can stay in these zones, so do not rely on them solely.
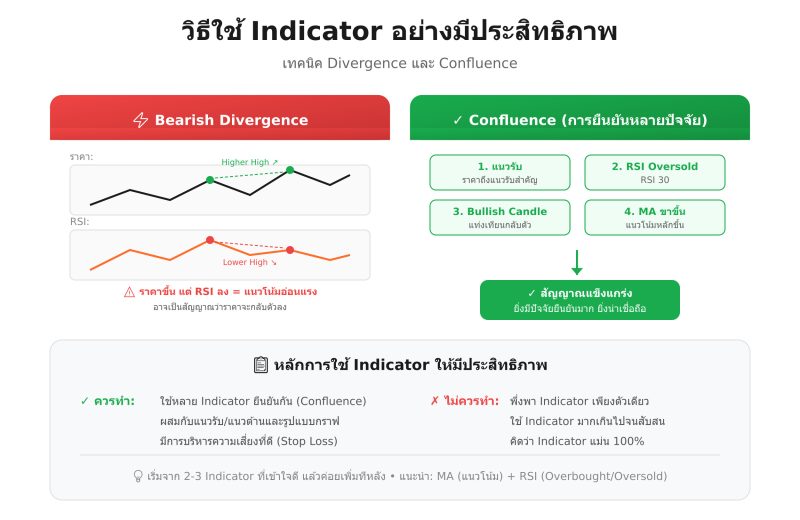
Divergence identifies potential reversals: price makes a higher high but RSI does not = bearish divergence; price makes a lower low but RSI does not = bullish divergence.
Combining indicators with support/resistance increases accuracy. Confluence occurs when multiple factors confirm a signal, making it more reliable.
Benefits of Using Indicators
Indicators offer many advantages, making them widely used for decades. Understanding these benefits helps you leverage them effectively, but only when used correctly and with awareness of limitations.
The main advantage of Indicators is that they help evaluate market trends more clearly. Rapid price fluctuations can be confusing when trying to determine the market direction. Indicators filter out short-term volatility and reveal the underlying main trend, making it easier to decide whether to trade with the uptrend or downtrend, or to wait until the market shows a clear direction.
Indicators also help identify better entry and exit points. Instead of guessing when to enter, an Indicator provides concrete signals, such as line crossovers, reaching predefined levels, or Divergence occurrences. These signals offer clear reference points for decision-making rather than relying on a feeling that it might be the right time.
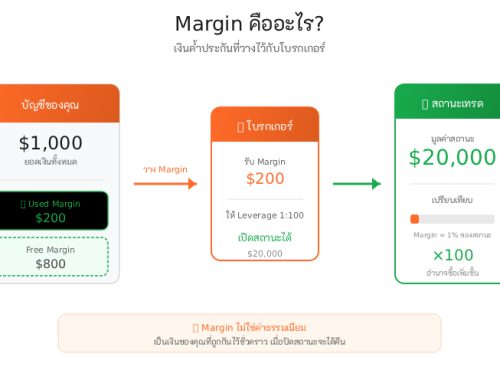
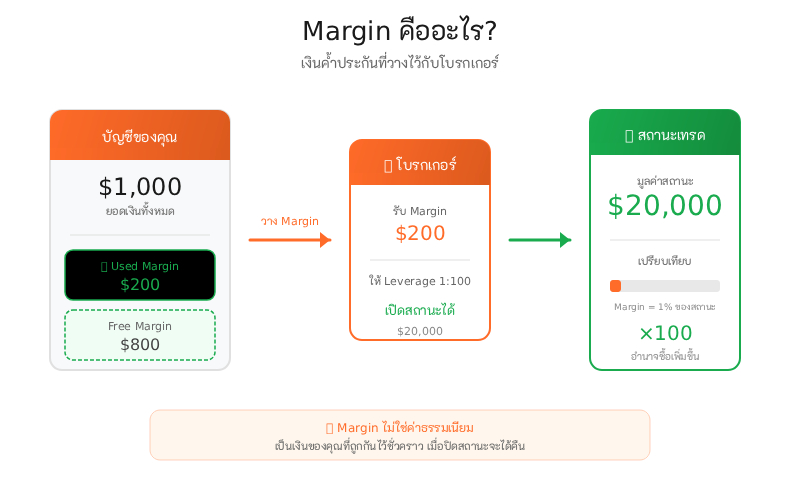
Additionally, Indicators help reduce trading risks. For example, volatility-measuring Indicators like ATR allow setting Stop Loss levels appropriate for market conditions, while trend-strength Indicators like ADX help avoid trading in markets with no clear direction. Indicators also support systematic investment planning, making trading more structured and allowing for backtesting.
Limitations of Indicators You Should Know
Although Indicators are very useful, they have limitations that must be understood. Using Indicators without understanding these limitations can lead to losses. Many beginner traders assume Indicators tell everything and are always accurate, which is not true.
The most important limitation is that no Indicator is 100% accurate, and they can never be, because they are calculated from historical data, not future predictions. The market can always move unexpectedly. Regardless of the signals provided, using Indicators requires accepting that mistakes will happen and implementing proper risk management to handle these errors.
Indicators should be used alongside other analyses to achieve the best results. Relying solely on Indicators is often insufficient. They should be combined with support/resistance analysis, chart patterns, news and fundamental factors, and other Indicators offering different perspectives. Using multiple tools together helps confirm signals and reduces errors.
The risk of false signals is another key limitation, especially in markets without clear trends. Indicators may provide frequent buy or sell signals, yet prices may not move accordingly, causing repeated losses. Learning to filter out false signals is a crucial skill that requires practice.
Indicators in Other Markets (Beyond Forex)
Indicators are not only used in Forex but can be applied in almost any financial market and even in business contexts. The basic principle is the same: use available data to calculate signals that aid decision-making, though values and methods may be adjusted to fit each market’s characteristics.
In the stock market, Indicators are widely used just like in Forex. The same Indicators, such as RSI, MACD, and Moving Average, can analyze individual stocks or indices. Key differences are that stocks have fixed trading hours, frequent daily gaps, and trading volume that can confirm signals better than Forex. There are also stock-specific Indicators like On-Balance Volume (OBV) and Advance/Decline Line.
In the cryptocurrency market, Indicators are also applicable but require caution due to higher volatility. Oscillators like RSI may remain in Overbought or Oversold zones longer than usual because crypto prices move sharply. Adjusting Indicator settings, e.g., using 80/20 levels instead of 70/30 for RSI, is often necessary. Since crypto markets operate 24/7, there are no daily gaps like in stocks.
In marketing and business, the term Indicator has a similar meaning but in a different context. Key Performance Indicators (KPI) are metrics used to evaluate the performance of a business or marketing activity. They process data to assist in decision-making, similar to trading, but in a business context.
What Are Indicators in Business? (Connection to KPI and KPI Risk)
Beyond technical trading use, Indicators also hold significance in business and organizational management. Understanding these meanings helps see the broader picture: Indicators are a concept applicable in multiple situations, not just trading.
Key Performance Indicators (KPI) are primary metrics used to measure an organization’s or activity’s success. KPIs inform management and teams whether the organization is moving in the right direction. Common KPIs include sales, net profit, growth rate, customer satisfaction, and retention rate. Good KPIs are measurable, aligned with organizational goals, and actionable.
Key Risk Indicators (KRI) are metrics used to warn of potential future risks. Unlike KPIs, KRIs focus on identifying risks rather than measuring success. Examples include employee turnover, bad debt levels, revenue volatility, and number of customer complaints. Organizations with effective KRI systems can address problems before they escalate into crises.
The connection between trading Indicators and business Indicators is the same fundamental idea: using available data to support decision-making, whether in trading or business. The principle is to transform raw data into understandable, actionable information.
Summary: What Are Indicators
Indicators are tools that analyze data and provide signals to aid decision-making, whether in trading or business contexts. In trading, they help analyze trends, find entry/exit points, and manage risk. They must be used with understanding and combined with other analyses. Indicators do not predict the future and are never 100% accurate. Usage requires practice and experience.
For beginners, it’s recommended to start with simple and easy-to-understand Indicators, such as Moving Average for trends and RSI for Overbought/Oversold conditions. Avoid using multiple Indicators at once initially, as it can be confusing. Start with one or two, learn them thoroughly, then gradually add more.
| Indicator Type | Example | Main Purpose | Best For |
| Leading | RSI, Stochastic | Predicting upcoming changes | Identifying reversal points |
| Lagging | Moving Average, MACD | Confirming existing trends | Trend-following trades |
| Oscillator | RSI, CCI, Stochastic | Measuring Overbought/Oversold | Sideways markets |
| Volatility | ATR, Bollinger Bands | Measuring volatility | Setting Stop Loss |
Frequently Asked Questions (FAQ)
What is the function of an Indicator?
Indicators transform historical price data into signals that assist market analysis, indicate trends, potential entry/exit points, Overbought/Oversold conditions, and trend strength, making trading decisions more structured.
What does Indicator mean?
An Indicator is a metric or tool that measures and presents data in an understandable format. In trading, it is a technical tool calculated from price and volume. In business, it represents performance or risk metrics.
How many types of Indicators are there?
Indicators can be categorized by function: Leading Indicators provide early signals, Lagging Indicators follow the price, Oscillators swing between high and low values, and Volatility Indicators measure market volatility. Each type is suitable for different market situations.
What is an Indicator?
“Indicator” is the English term used in Thai as well. It refers to a metric or technical analysis tool in trading that helps visualize trends and signals not easily seen from price charts alone.
What is a Forex Indicator?
A Forex Indicator is used to analyze the foreign exchange market. The principle is the same as other markets but may be adjusted to fit Forex characteristics, such as 24-hour operation and high liquidity.
What is an RSI Indicator?
RSI (Relative Strength Index) is an oscillator measuring price strength, ranging from 0–100. Values above 70 indicate Overbought, below 30 indicate Oversold. It helps identify possible reversal points and divergences.
What is the difference between Leading and Lagging Indicators?
Leading Indicators provide signals before prices change, predicting in advance. Lagging Indicators provide signals after price changes, confirming trends. Leading Indicators are faster but may give false signals; Lagging Indicators are slower but generally more accurate in trending markets.
What is an Oscillator Indicator?
Oscillator Indicators swing between defined high and low values. They indicate Overbought and Oversold conditions, perform well in sideways markets, but may give false signals in strong trends. Examples: RSI, Stochastic, CCI.
How to use Indicators accurately?
To use Indicators effectively, combine them with other analysis rather than relying solely on them. Choose indicators suitable for market conditions, confirm signals with multiple indicators, support with trend lines and chart patterns, and implement proper risk management as no indicator is 100% accurate.
You might also be interested in:


Leave A Comment